


More Wishful Thinking about Transit
No, IndyGo Isn't Doing What It Promised
Introduction
A further example of the wishful thinking that tends to afflict transit-subsidy proponents came to our attention after “The Transit-Proponent Viewpoint” had already been posted. The example we used in that previous post had been written by a transit consultant, whereas the new example took the form of an email message from an Indianapolis City-County Council member. We’ll use excerpts from that message in this post to illustrate another aspect of subsidy-proponent thought. And we’ll show that a Council member’s sense of how important city-bus transportation is can be rather inflated.
The Message
Our correspondent’s message was a response to “IndyGo’s 2025 Budget.” In that post we speculated that the Indianapolis Public Transportation Corporation (“IndyGo”) would withhold several salient facts when it makes its budget presentations to the Council. Among those facts was that IndyGo bus rides are more expensive to provide than cab rides are and that replacing IndyGo bus trips with car trips would reduce Indianapolis’s carbon footprint.
Now, perhaps our correspondent just doesn’t care whether providing IndyGo transportation costs more than it’s worth or whether IndyGo is “sustainable.” Many politicians do seem to subordinate such considerations to an unshakable belief that subsidized transit is a Good Thing of which criticism should be stamped out. The message’s statement that “I’ve reviewed your numbers and frankly don’t find them very concerning” does lend itself to that interpretation.
“Doing What They Promised to Do”
But for present purposes we’ll interpret that remark as instead reflecting a belief that IndyGo’s currently abysmal performance will be turned around by the operational expansion that a 2016 referendum approved a transit income tax to fund. Presumably the following passage was intended to justify that belief:
Many companies and public organizations do not turn a profit while they are in a rebuilding phase. Amazon famously did not turn a profit for decades. But they grew their capacities and provided themselves the tools they needed in order to profit eventually - and that seems to have worked out well. Amazon is a private company that eventually went public, so they needed to convince first their owners and then their shareholders that this plan had merit and would eventually pay off. IndyGo is a municipal corporation, so they needed to convince a much broader audience - the taxpayers and voters. They did so, pretty conclusively, and they are doing what they promised to do.
We note in passing how inapt such an analogy was in that context; the consequences visited upon founders whose public-offering documents fall short of full disclosure can be severe, whereas IndyGo suffers no consequences from misleading statements and material omissions of the type we described in “Advocacy as ‘Educating.’” More to the point, any half-baked idea at all would qualify for financial backing if the test were merely whether some other, vastly different enterprise has ever succeeded.
In this case decades of data give us ample reason to expect that the expansion’s main effect from an efficiency standpoint will be merely to make IndyGo buses even emptier. We won’t belabor that point here, because we already saw in “The Transit-Proponent Viewpoint” that expecting any further expansion to improve performance significantly is a triumph of hope over experience. What we will consider is our correspondent’s remarkable statement that “they are doing what they promised to do.” As we will now see, nothing could be further from the truth.
The Game Plan
As described to referendum voters, a large portion of IndyGo’s plan for the transit-tax-funded expansion consisted of converting five or so of IndyGo’s thirty-odd conventional routes into three bus-rapid-transit (“BRT”) routes: the Red, Purple, and Blue Lines. The BRT routes would be distinguished by all-electric buses that would travel in dedicated bus lanes from which other traffic is excluded. On weekdays the BRT buses would come every ten minutes, whereas the other, “local” routes come at most every fifteen minutes. And BRT bus stops would be fancy new stations that feature off-board fare collection, level boarding, and arrival-time displays.
The remainder of the expansion would consist of increasing local routes’ frequencies and extending their hours to the extent that between the BRT lines and the local routes the average number of buses on the streets would be 70% greater than before the expansion. IndyGo also likes to characterize the expansion as converting the network as a whole from a “hub-and-spoke” to a “frequent grid” layout.

Now, the routes in a hub-and-spoke arrangement predominantly extend between a central downtown region and outlying locations. And perhaps a reader who squints may indeed be able to see slightly more routes like that in the left, before-expansion map above than in the right, after-expansion map. But both layouts seem to be predominantly of the grid type, with east-west routes intersecting north-south routes. The main differences between the maps are the frequency-indicating route colors.
Anyway, the paths of the Purple and Blue Lines differ little from those of previous Routes 39 and 8, so the contribution made to the network’s grid character by conversion of the latter routes to BRTs would mainly be that the BRT routes’ higher frequencies would shorten the waiting times of transferring passengers. And even that effect was to be rather limited, because on most stretches of those two routes buses already came every fifteen minutes.
Arguably more significant was the Red Line. Buses hadn’t come more often than every half hour on the routes it replaced, so its ten-minute headways would make it more effective as a spine to which east-west routes connect. Perhaps for that reason the Red Line was to start operating first, in 2018, with the Purple Line following in 2020 and the expansion reaching its target 70% service increase with commencement of the Blue Line in 2021.
That was the game plan, which our correspondent partially regurgitated thus:
They are spending significant amounts of money to grow their fleet, grow their ridership, and create huge bus rapid transit lines that will enable them to move away from the current hub-and-spoke model and increase people's ability to take the bus to get to where they need to go.
The Actual Game
In reality the Red Line didn’t begin operation until September 2019. Once its operation did start, IndyGo designated the summer of 2020 as the time for local routes to “move away from the current hub-and-spoke model”; there was no reason to wait for the Purple and Blue Lines. But that move didn’t happen, the Purple Line is now four years late, the Blue Line’s planned completion date has slipped to three years after the Purple Line’s, and not much else that IndyGo promised has come to pass, either.
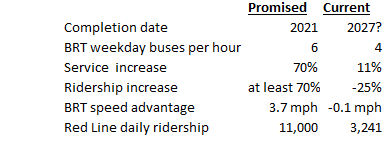
For example, the “conservative” Red Line ridership estimate that IndyGo gave referendum voters was 11,000 trips per day, whereas in actuality Red Line ridership doesn’t average even a third of that value. By two years after transit-tax collection started in 2018 the local-service increase together with the Red Line’s six-buses-per-hour frequency was already supposed to have increased overall service by 60%. Despite having now collected transit tax for six years, however, IndyGo has increased service by only 11%; the Red Line comes only four times per hour instead of six, and IndyGo hasn’t used those transit-tax receipts to increase local-route service as much as it said it would.
Moreover, the ridership shortfall hasn’t been limited to the Red Line; overall ridership is less than half of what it should have been by now. Part of that shortfall was probably baked in from the beginning, because to obtain Council imposition of the transit tax IndyGo made a prediction that it should have known was unrealistic.
Specifically, in a January 2017 presentation IndyGo told the Council that ridership would increase at least in proportion to service. This implies that the 70% increase in service would cause ridership to increase by at least 70%. But only two years later—i.e., before the Red Line began operation and showed how poor its popularity prediction had been—a ridership projection that the Thrive Indianapolis plan presumably obtained from IndyGo was that the expansion’s 70% service increase could result in ridership’s increasing by as little as 15%.
As we explained in “Inelastic Ridership,” moreover, IndyGo’s long-term records suggested that it had already picked all the low-hanging fruit, to the extent that the Thrive projection may well prove to be optimistic. Whether it ultimately will is something we don’t know yet, of course; the service increase hasn’t yet reached the promised 70%. But ridership hasn’t increased by even the paltry 11% that service has; in fact, it’s declined by 25%.
As we observed in the previous post, moreover, the Red Line hasn’t achieved the increased speed and reliability that the BRT routes’ dedicated lanes and off-board fare payment were supposed to afford. While the numbers IndyGo gave the Council in 2017 implied a speed advantage of 3.7 mph over the local routes, the Red Line is actually slightly slower than they are. It’s late more often, too. On top of that, those sixty-foot Red Line behemoths appear difficult to handle; over the last twelve months Red Line buses have had four and a half times as many preventable accidents per revenue mile as the local routes’ buses have.
The Pandemic
Of course, transit agencies tend to blame their woes on the 2020–2021 pandemic, and it certainly did have an effect on ridership. But readers should ask themselves how significant a delay in other expansion milestones the pandemic can really be blamed for. Moreover, the pandemic may actually have been a financial windfall for IndyGo; the torrent of pandemic-related federal aid has probably dwarfed the reduction in fare revenue, which was already small before the pandemic. And any lingering ridership effect the pandemic still has may actually be a sign that IndyGo needs downsizing.
Anyway, the belief that “they are doing what they promised to do” bears little resemblance to reality, no matter how much IndyGo may want to blame that on the pandemic.
IndyGo Transportation Is a Drop in a Bucket
The message also suggested that our correspondent may have a rather inflated impression of how significant IndyGo transportation is. In “IndyGo’s 2025 Budget” we observed that IndyGo costs taxpayers more than cab transportation would. Our correspondent responded that using cabs instead of buses would “create far more traffic on the roads and require additional lanes”:
Your comparison to cabs, especially, seems odd to me. DPW’s recent budget presentation has made it clear that we cannot continue maintaining our streets at even the (in my opinion unacceptably poorly maintained) condition they are in today. We are facing a huge revenue cliff and have far more lanes than we can maintain. Transitioning all bus riders to use private cabs instead would create far more traffic on the roads and require additional lanes, which we can't afford. And as a person who shares a car with my [spouse], I think your estimate on what a cab ride costs is not accurate at all. Further, cab prices are likely to continue trending higher, as both labor and gas are not getting any cheaper.
Readers are encouraged to decide for themselves whether our cab-cost estimates were in the right ballpark; on that issue we’ll merely observe that there’s no reason to believe IndyGo is any more immune to labor- and fuel-cost increases than cabs are. What we’ll concentrate on instead is the “far more traffic” assertion.
As “How Many Residents Ride IndyGo?” showed, only a tiny fraction of the Indianapolis population takes IndyGo even once a year. And even most residents who do take the bus probably travel more by car. We estimate that IndyGo provided only about 33 million passenger-miles over the past twelve months, even if we include transportation not only from IndyGo’s buses but also from the IndyGo vans that qualified disabled residents can take.
Even if we ignore the traffic on state and US roads and interstates, on the other hand, the aggregate distance traveled on the remaining Marion County streets and roads was still something like 7.6 billion vehicle miles last year. So the traffic increase caused by replacing buses with cabs would be less than half a percent even if no erstwhile bus riders shared their cabs.
Half a percent falls somewhat short of “far more traffic.”
Since our correspondent has chosen to bring up tiny traffic effects, moreover, we’ll mention that the expansion itself will probably increase traffic—by adding more buses on the streets than riders in the seats. Based on long-term data, the IndyGo-ridership incremental service elasticity calculated in “Inelastic Ridership” suggests that the Thrive projection of only a 15% ridership for a 70% increase in service may actually be high; that post’s calculations inferred an incremental elasticity of 0.158 instead of the (log(1.15)/log(1.7) ≈) 0.263 that Thrive’s 15% increase implies. If we nonetheless apply the Thrive-implied elasticity to an assumed bus occupancy of 4 passengers per bus—which exceeds IndyGo’s current average—we find that the planned 55% further service increase will add less than a single rider in the seats per added bus on the streets.
And an on-board survey suggests that only about half of IndyGo bus riders would otherwise have gone by car. So it’s entirely possible that the number of buses that IndyGo’s expansion adds to the streets will be twice as great as the number of cars removed from the streets because their owners have left them at home in favor of the bus.
In the scheme of things the volume of IndyGo transportation just isn’t at all significant.
But Not the IndyGo Budget
In contrast, the local-tax portion of the IndyGo subsidy alone is nearly half the size of the entire $246 million DPW budget, and at $342.2 million the proposed IndyGo budget as a whole is nearly 40% greater. IndyGo costs much more than it’s worth, and the subsidy-burden relief from shutting IndyGo down would more than make up for any added public-works expense that the minimal traffic increase might cause.
Conclusion
IndyGo’s contribution to Indianapolis transportation is de minimis, IndyGo has definitely not done what it promised, and voters are not getting what they voted for. As we pointed out in “Advocacy as ‘Educating,’” moreover, IndyGo and its henchmen weren’t very candid about what the original plan’s implications would have been even if it had been carried out flawlessly.
For example, the transit tax will pull in about $75 million next year, while the Thrive projection was that the transit-tax-funded expansion would increase ridership by as little as 15% over 2016’s 9.2 million. That works out to over $50 per added bus ride, or over three times the cost of a cab. Would as many voters have supported a transit tax if they’d all known that? Or known that the expansion would increase the Circle City carbon footprint?
But they didn’t, because IndyGo withheld such implications from them. Nor has IndyGo done much since to enlighten them, either under the previous CEO or under the current one. Worse, the press is often complicit in misleading the public. And our correspondent’s message shows that Council members are nonetheless willing to ignore facts in order to regurgitate IndyGo propaganda.
When the electorate is thus kept in the dark the government’s interference in an activity that should have remained in the private sector is particularly harmful. IndyGo’s subsidy should be discontinued.
Clearly you hit a nerve; I'm impressed that you were able to generate a response. They know deep down in their government-can-do-no-wrong hearts that it is, always has been and always will be a boondoggle. So, they just repeat the same spiel and hope no one really notices how bad it really is.