
A couple of blog posts by an Indianapolis Public Transportation Corporation (IndyGo”) consultant named Jarrett Walker recently came to our attention. Followed to its logical conclusion, one of them would imply that the expansion upon which IndyGo embarked six or so years ago is “hard to defend.” The present post will not only present that logic but also show that IndyGo was probably too big for Indianapolis even before the expansion. And our next post will use the other of Mr. Walker’s posts to illustrate the wishful thinking and lack of logic that often underlie such hard-to-defend projects.
Jarrett Walker and IndyGo
Mr. Walker performed IndyGo’s 2015 Comprehensive Operational Analysis and contributed significantly to the Marion County Transit Plan, which was something of a blueprint for IndyGo’s expansion. He apparently advised IndyGo that it could build ridership by investing in a connected network of routes that are relatively linear and run through more or less continuous areas of density and walkability. In any event, that was what the Marion County Transit Plan ostensibly proposed.
Ridership vs. Coverage
Still, Mr. Walker sometimes downplays ridership. One reason he has sometimes given for doing so is that obtaining support for transit subsidies can require sacrificing ridership in favor of “coverage.” A transit agency might attract more financial support, for example, by covering a key councilor’s district even if doing so results in largely empty buses that would have provided more transportation if they’d been run elsewhere.
Now, he often puts a less-political gloss on the coverage argument. A route that attracts little ridership, he may say, can nonetheless provide a “lifeline” to residents whose rides are infrequent but particularly important when they’re taken. It must be said that this lifeline argument has an element of truth; a trip to the doctor to check out an alarming blood-pressure rise is presumably more valuable than a trip downtown for a change of scenery. But it’s not clear that a transit system wouldn’t provide more lifelines if it were so configured as to maximize ridership instead of coverage.
As a justification for transit-system subsidies, moreover, the coverage argument is usually just too qualitative. Sure, there’s some value in having city buses as lifelines. But the tax required to provide those lifelines will make taxpayers less able to afford other things, like heat for their houses and insulation for their attics. If we want to balance the needs of riders against those of the taxpayers who subsidize them we need some more-quantitative measure of how valuable the coverage is.
Low Ridership Is “Hard to Defend”
So it was notable that Mr. Walker’s post entitled “Is Microtransit a Sensible Transit Investment?” actually made a stab at being more quantitative. That post was part of a series he wrote about “microtransit,” i.e., about services in which the transit vehicle goes where the riders direct it to go instead of following fixed routes as city buses typically do. (In addition to its normal, “fixed-route” bus system IndyGo runs vans that provide such a “demand-response” service, but the IndyGo expansion is focused on the former rather than on the latter.) His post’s quantitative aspect was the figure of merit it used: the number of bus rides a route gives per service hour. That quantity, he said, “corresponds roughly to ‘bang for [the] buck’ for public investment.”
And the impression his post conveyed is that this metric often militates against microtransit use. Microtransit pilot projects had been averaging no more than about three trips per service hour, he wrote, whereas the range for an “urban frequent bus” was forty to a hundred. Although he implied that even fifteen to forty trips per service hour might justify a suburban bus route, he stated that only ten trips per service hour would not: “Even in the context of coverage goals, those routes are hard to defend.”
Let’s apply that standard to IndyGo’s expansion, which is planned to increase service hours by 70% over its 2016 level of 518,142. In this context the coverage argument isn’t very compelling; the expansion seems on track to reduce IndyGo route miles and bus-stop count rather than increase them, so if anything the expansion seems more likely to de-emphasize coverage. And for the expansion to achieve even the hard-to-defend level of only ten additional trips per added service hour IndyGo ridership would need to increase by (10 trips/service-hour × 70% of 518,142 service-hours ÷ 9,193,293 trips ≈) 39% over its 2016 level of 9,193,293 trips. Yet the projection given by the city’s Thrive Indianapolis plan for fixed-route ridership was an increase of as little as 15%: less than four additional trips per added service hour.
True, Thrive’s projection was that ridership would increase by at least 15%, so the actual increase could be greater. As “Inelastic Ridership” explained, however, Federal Transit Administration (“FTA”) ridership and service data from before the pandemic suggest that if anything the Thrive estimate of 15% is likely to prove optimistic:
Take 2019, which was the last pre-pandemic year. According to the FTA data, service on IndyGo’s main, fixed-route system had already increased by 14%, to 591,047 vehicle revenue hours from 2016’s 518,142. Moreover, bus rides were free system-wide for two weeks that year to publicize commencement of Red Line service. And rides were free on the Red Line itself for three full months. Yet that year’s ridership, 9,235,684 bus rides, exceeded 2016’s 9,193,293 by less than half a percent. This implies that the elasticity, or ratio of percentage changes, is only about 0.03. With that elasticity the 70% service increase would change ridership by only 2% even without the pandemic’s negative influence.
What longer-term data actually reveal, in fact, is a secular ridership decrease despite a secular service increase, so a naïve inference might be that for most periods IndyGo ridership’s service elasticity has been negative.
Of course, the elasticity calculation probably wouldn’t end up with a negative value if corrections were made for exogenous factors; everything else being equal, a service increase shouldn’t cause ridership to decrease. So even if there’d been no service change IndyGo’s ridership would presumably still have decreased with time, maybe because residents have been getting richer and/or working more from home.
But even after backing out the secular ridership trend the incremental-elasticity value that our previous post arrived at was only 0.158. And if that (again, incremental) value were uniform it would imply a ridership increase of less than (1.70.158 – 1 ≈) 13% in response to the 70% service increase. By Mr. Walker’s standard a ridership increase even three times that great would still be “hard to defend.”
Ridership and Expenditure Estimates
Mr. Walker gave no real justification for his standard, but we’ll use IndyGo’s recent and projected performance numbers to show that at least in IndyGo’s case his standard makes sense. First, though, we’ll state explicitly why trips and service hours matter.
Multiplied by the average number of miles per trip, the number of trips tells us how much transportation is being delivered. Multiplied by cost per service mile the number of service miles tells us how much delivering them costs. And taking the resultant quantities’ ratio gives us the real “bang for the buck” measure: passenger-miles per dollar. So in the following discussion we’ll use IndyGo numbers to substitute (actually, the reciprocal of) this more-direct measure for Mr. Walker’s trips-per-service-mile metric, which as he said would correspond only roughly to the expansion’s “bang for the buck.”
We’ll base our pre-expansion “bang” value on 2016’s 40,501,760 fixed-route passenger miles instead of the 9,193,293 trips into which they were divided, so the assumed 15% increase implies that after the expansion IndyGo will provide about 46 million fixed-route passenger-miles per year.
Since most Indianapolis City-County Council members seem to look upon federal dollars as free money, we’ll base our pre-expansion “buck” estimate on IndyGo’s 2016 sum of passenger fares and only non-federal taxes: $60,408,800. Guided by the allocation IndyGo apparently made in its reports to the FTA, we’ll exclude 14% of that as having funded IndyGo’s demand-response service instead of the (fixed-route) service to which its expansion is directed. Translating the remainder into 2023 dollars in accordance with the Consumer Price Index gives us about $66 million as our pre-expansion “buck” estimate.
The taxes listed in IndyGo’s 2023 annual report include the special transit income tax that Indianapolis introduced in 2018 to fund IndyGo’s expansion. So we’ll base our post-expansion estimate on that report’s numbers. Our calculation of that estimate from the 2023 numbers will be largely the same as our calculation of the pre-expansion estimate from the 2016 numbers. Consistently with our ridership-increase assumption, however, we’ll replace 2023’s low fare-revenue quantity with a value 15% higher than 2016’s. Our resultant estimate of post-expansion expenditure is about $122 million.
Exorbitant Unit Cost
As an estimate of the expansion’s aggregate annual cost the $57 million1 difference between those pre- and post-expansion cost estimates may be conservative; residents are probably coughing up more than that in transit tax. Even based on that conservative estimate, however, the cost of increasing IndyGo transportation is a whopping $9.37 per passenger-mile. True, that’s based on Thrive’s 15%-ridership-increase projection, which translates to less than four trips per service-hour. But even Mr. Walker’s ten trips per service hour would come to $3.74 per passenger-mile. And that’s the figure we’ll now use to confirm his conclusion that ten trips per service hour is “hard to defend.”
The average length of an IndyGo bus ride is 4.4 passenger-miles/ride, so even at only $3.74 per passenger-mile the addition of a single ride would cost more than $16. Now, it’s not hard to imagine exigent circumstances in which we’d consider a 4.4-mile bus ride worth more than $16. But the average city-bus ride would be worth less to the rider—and certainly less to the taxpayer—than what he could otherwise have bought with that $16. For example, a taxpayer could probably fill his kid’s lunch box for a week on that amount.
A similar conclusion results even if we restrict our attention to transportation. According to Edmunds the total cost—including insurance, maintenance, repairs, taxes, fees, financing, depreciation, and fuel—of owning a Honda Accord hybrid driven 75,000 miles in five years is $38,893. That works out to 41¢ per passenger-mile if we assume an average urban car occupancy of 1.25 people per car. And this is based on someone who trades his car in for a brand-new one every five years instead of holding on to it for a decade or more as the average owner does. True, personal motoring gets its own subsidies, which transit advocates often manage to convince themselves are huge. But in reality they probably amount to not much more than a cent or so.
Air transportation, too, is inexpensive by comparison with the expansion; a $319 ticket for a 590-mile plane flight from Indianapolis to D.C. works out to 54¢ per passenger-mile. That’s less than a sixth of what the expansion’s added transportation will cost even if the expansion ends up adding Mr. Walker’s ten additional trips per added service-hour instead of less than four as Thrive projected.
We note in passing that IndyGo riders bear only a tiny fraction of their rides’ cost. Although IndyGo’s $1.75 full-fare price equates to ($1.75/ride ÷ 4.4 passenger-miles/ride ≈) 40¢ per passenger-mile, the average fare after various discounts and giveaways is closer to 22¢ per passenger-mile: the riders added by the expansion will pay less than 5% percent of the expansion’s cost. And they’ll pay only a little over half as much as the full cost of car transportation although arguably more than cars’ marginal mileage cost.
Even cab transportation, which most residents probably consider too expensive for most trips, is less expensive than the transportation the expansion will add. Let’s say cab fare consists of $2 per mile on top of a $3 pick-up charge. With tip a cab ride whose length is the 4.4-mile IndyGo average will cost $14.16. If cabs were never shared this would come to $3.22 per passenger-mile. Since cabs are indeed shared but we don’t know how often, let’s say that 22%, 6%, and 2% of cab rides are respectively shared by 2, 3, and 4 passengers. If we throw in a $0.65 charge per extra passenger, cab transportation under those assumptions averages $2.35 per passenger-mile: only a quarter of what IndyGo is charging residents for the expansion.

Fig. 1 summarizes those comparisons’ demonstration that the IndyGo expansion’s cost of providing added rides dwarfs those rides’ average value even to the rider and that it would be hard to defend even if the expansion added ten trips per additional service hour. From the standpoint of optimal resource allocation, that is, the expansion is making IndyGo too big for the city it serves: right-sizing IndyGo would involve substantially pruning unproductive routes and times. And we will presently demonstrate that IndyGo was probably too big even before the expansion.
Less-Than-Complete Information
First, though, we’ll emphasize that we have less-than-precise values for the quantities the demonstration will be based on. Specifically, we don’t know with any precision how much a given reduction in IndyGo’s pre-expansion funding would have reduced the transportation that IndyGo provides. We emphasize this because Mr. Walker sometimes seizes upon such uncertainty as a pretext for downplaying ridership.
Relying on a rather simplistic view of what constitutes a city, he argues that transit planning should instead be based on something more certain: geometry.

Readers who want to hear a complete example of this argument can find it here at 27:30 et seq. Briefly, though, he used the poster above to illustrate the geometric certainty on which he relied: that whereas we can’t predict ridership we do know with certainty that the number of people who can simultaneously occupy a vehicle is much greater for a bus than for a car.
Now, that certainty might be more relevant if the fact that a bus can hold some number of people meant that it actually will hold that many people. But IndyGo buses’ capacities tell us almost nothing about what their actual occupancies will be. This leaves a logical gap between Mr. Walker’s premise and his conclusion. So, although future ridership is indeed uncertain, it’s more relevant than capacity is to the question before us: whether the value of the rides that paring IndyGo back would have eliminated is as great as that of the money that such right-sizing would have saved taxpayers.
Hypothetical Cost Functions

To answer that question we therefore begin, as Fig. 3’s “pre-expansion” and “post-expansion” points show, by plotting our estimates of pre- and post-expansion IndyGo transportation against our corresponding expenditure estimates. Again, the post-expansion estimates are based on the Thrive projection of a 15% ridership increase, and we can’t rule out more ridership than that. But the “2023 estimate” point shows that we have little reason to expect such higher ridership; that point is based on actual 2023 ridership, which was 29% less than 2016’s even though in 2023 IndyGo service hours were 10% greater.
True, the completed expansion is supposed to provide 70% more service hours instead of only 10% more, and we can expect some further recovery from the pandemic. As we explained above, though, the low service elasticity that IndyGo’s ridership exhibited even before the pandemic suggests that further service increases will mainly just make buses emptier; they’re unlikely to give ridership much of a boost.
To show why instead of being expanded IndyGo should probably have been downsized we’ll estimate how much it might cost for IndyGo to provide various lesser amounts of transportation. To this end we’ve drawn curves in Fig. 3 to represent transportation as five different hypothetical functions of the cost required to provide it.
The two leftmost curves are steep at their left ends and concave throughout, representing scenarios in which the incremental cost of providing more transportation is small at low IndyGo budget levels and always increases with the quantity of transportation already provided. To pass through our assumed before- and after-expansion points the other three curves necessarily have concave portions, too. But their leftmost portions represent scenarios in which administration costs would eat up too large a portion of a small budget to leave much for actually running buses. So those portions are convex, indicating that initially the incremental cost of providing more transportation decreases with the quantity of transportation already provided.
Bounding Curves
Again, Fig. 3’s curves are merely hypothetical. As we will now see, though, the actual function would probably fall somewhere between the left- and rightmost curves; at low budget levels leftmost function seems too optimistic, whereas the rightmost one seems too pessimistic.
The leftmost function seems too optimistic because among the things it implies is that for an annual budget of only a million dollars IndyGo could provide nearly 3.5 million rides if the rides’ average length is IndyGo’s current 4.4-mile average. A million dollars per year would fund only seven buses running less than eight hours a day even if IndyGo’s total cost—including labor, fuel, maintenance, and overhead—were no more than $50 per vehicle-hour. If the average bus ride takes twenty minutes, that means that occupancy has to average over 57 simultaneous riders: equivalent to all buses’ exceeding their seating capacity all the time. That’s highly improbable.
The rightmost function, on the other hand, seems too pessimistic; it implies that even for $15 million per year all buses together could attract only seventeen riders per hour. Even at as high an expense rate as $200 per vehicle-hour $15 million would be enough to keep 25 buses on the streets eight hours per day. That works out to an average occupancy of less than (17 passengers/hour × 20 minutes/passenger ÷ 60 minutes/hour ÷ 25 buses <) a quarter of a passenger per bus.
So although those functions are merely hypothetical they’ll give us some insight in deciding whether IndyGo was already too big before the expansion started. For that purpose we’ll use the marginal costs that those curves imply.
Marginal Unit Cost
Before we do we’ll review the distinction between marginal and average unit costs. The average unit cost is the ratio of total cost to total transportation, which in Fig. 3 is the ratio of x- to y-values: $2.63 per passenger-mile in the case of the post-expansion point. But what we’re interested in when we evaluate IndyGo’s expansion is whether the resultant transportation increase is worth the increased expense. So the $9.37 per passenger-mile represented by Fig. 1’s right-hand bar is the marginal unit cost: the ratio of differences between pre- and post-expansion quantities.
Difference ratios will similarly be the basis of our assessment of whether IndyGo’s size should have been reduced instead of increased. Instead of finite differences as we used above, however, the differences we’ll start with here will be infinitesimal.

Specifically, the Fig. 4 curves’ y values are the reciprocals of the Fig. 3 curves’ derivatives: they represent the ratios that infinitesimal expenditure changes bear to the resultant infinitesimal transportation changes.
Of particular interest are the Fig. 4 curves’ values at the pre-expansion expenditure level. At that level all curves but the lowest one—which represents a scenario we’ve seen is implausible—indicate that even before the expansion the savings from at least some downsizing would have exceeded the cost of taking cabs. So it’s hard not to conclude that the money thereby saved would on average have been more valuable to taxpayers than the eliminated rides would have been to riders.
A Thought Experiment
Still, the post-expansion point through which Fig. 3’s curves were drawn was based on the 15% ridership increase projected by Thrive. What if the ridership increase ends up being more than that? Fig. 1 already showed us that even the 39% increase implied by Mr. Walker’s ten riders per service hour would make the expansion “hard to defend.” But downsizing from the pre-expansion level is a different question. And that question becomes less clear if the post-expansion point we draw our function curves through is based on that 39% increase instead of Thrive’s 15% increase.
To make things clearer we’ll therefore approach that question from a slightly different angle. Specifically, we’ll perform a thought experiment in which the fares for selected bus rides are so priced as to cover actual cost. We’ll also enable riders to afford the higher fares so that if they nonetheless decline to pay those fares it’ll be because the rides cost more to provide than they’re worth to the riders.
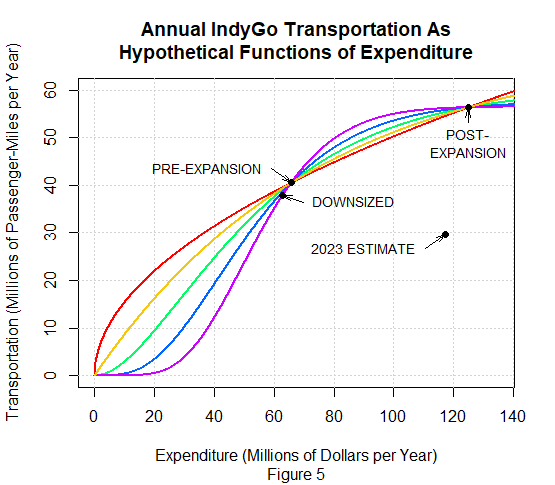
Fig. 5 above shows that basing the curves on a 39% ridership increase makes all the curves steeper than they were in Fig. 3, while Fig. 6 below shows that it lowers the marginal-cost curves significantly from their Fig. 4 positions.
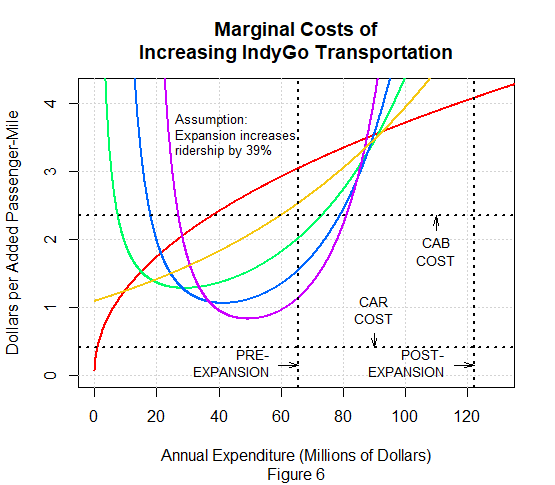
At the pre-expansion expenditure level the lowest curve indicates that before expansion a small service reduction would have saved only $1.15 per passenger-mile eliminated, or only $5.08 per eliminated trip. This will on occasion be less than the IndyGo trip is worth to the rider, but our thought experiment will show that riders probably don’t consider trips worth that much on average.
The thought experiment’s focus will be the small expenditure-level change between Fig. 5’s downsized and pre-expansion points instead of the large change between its pre- and post-expansion points. Let’s say that the downsized and pre-expansion points are close enough to each other that the ratio their expenditure difference bears to their transportation difference is only slightly lower than the pre-expenditure level’s $1.15-per-passenger-mile marginal unit cost.
Let’s call that ratio $1.10 per passenger-mile, or about $4.84 per trip: in the lowest curve’s scenario downsizing would have saved an average of $4.84 per trip it eliminated. But for the thought experiment’s purposes we’ll express this in reverse: $4.84 is the expenditure required per added trip to increase transportation from the downsize level to the pre-expansion level.
Our thought experiment involves a time machine that enables us to re-run some year in which IndyGo has operated at the levels that Fig. 5’s pre-expansion point represents. We’ll call that year’s original version “Take 1” and the re-run “Take 2.” A small subset of Take 1’s rides would not have been taken if IndyGo had instead provided only the service level that’s consistent with the downsized expenditure level. We’ll call these the “added rides,” and our thought experiment’s subjects will be the riders who took them.
We’ll assume that in Take 1 the average fare was the same for the added rides as it was for all rides generally and that this average was the $1.25 in 2023 dollars that IndyGo’s 2016 fares averaged after discounts and giveaways. (In real life IndyGo’s failure to adjust its fares has left the current-dollar average fall to around $1.00.) For most rides $1.25 will also be the average in Take 2.
But if possible the fare for the added rides in Take 2 will be high enough to cover the difference between the downsized and pre-expansion expenditure levels. And riders will be able to afford the higher fares because at the beginning of Take 2 enough money to do so will magically appear in the bank accounts of the riders who took the added rides in Take 1.
Feedback Loop
The previous paragraph included that “if possible” proviso because the mere fact that riders will be able afford the added rides’ higher fare doesn’t necessarily mean that they’ll actually be willing to pay that much for a bus ride, and no fare price is high enough to cover the added cost if not enough riders are willing to pay it. For the reasons that follow, moreover, we think that not enough would.
Let’s say IndyGo charges $4.84 apiece for the added rides. If all of Take 1’s added rides are again taken in Take 2, fares for the added rides will indeed cover the service-increase cost. But riders will undoubtedly decide instead that some significant fraction of those added rides aren’t worth the fare price. After all, that higher price is almost four times what the subject riders paid in Take 1, and it’s more than two and a half times our estimate of a car’s fully loaded cost—which in turn is greater than cars’ marginal cost per additional passenger-mile. This suggests an unfortunate feedback loop: to cover the service increase’s cost the fare price will have to be set higher than $4.84, which will further reduce the number of riders willing to pay, which will further increase the necessary fare price, etc., etc.
Now, in theory this feedback loop wouldn’t necessarily prevent a high enough fare increase from covering the expenditure increase. For it not to, though, the percentage ridership decrease would have to be less than the percentage fare-price increase that caused it. And we know that in real life ridership is usually more elastic than that; otherwise not all major U.S. transit agencies would need subsidies.
True, our experiment includes a magical cash infusion that real life doesn’t. But we’ll now confess that in a sense the cash infusion was a red herring. Through most of the last century fares could still be set high enough to cover expenses even though incomes were much lower than they are now. So an inability to afford higher fares probably wouldn’t be a major reason for resisting higher fares.
In short, changing our hypothetical functions’ basis to a decidedly optimistic 39% increase doesn’t change our conclusion; even to the riders themselves the rides that downsizing would have eliminated probably weren’t worth their actual cost. Instead of expanding, therefore, IndyGo should have contracted.
Conclusion
We’ve confirmed an implication of Mr. Walker’s standard: that IndyGo’s expansion is hard to defend. We’ve also seen that IndyGo was probably too big even before its current expansion.
But we’ll see in our next post how transit proponents like Mr. Walker might resist that implication.