


Inelastic Ridership
Will IndyGo's Expansion Cost Indianapolis Taxpayers $92 per Added Ride?
Introduction
In this post we construct a model to estimate what Indianapolis Public Transportation Corporation (“IndyGo”) ridership will be when that bus company has completed its current expansion.
Next year’s IndyGo operating1 and capital2 expenditures will together exceed the city’s entire $212 million public-works budget. Yet even before the pandemic not one Indianapolis resident in thirty rode the bus. And next year’s ridership is unlikely to exceed 6 million. So the $250 million IndyGo plans to spend that year will exceed $40 per ride. Obviously, that’s exorbitant; it’s more than enough to pay for three times that many cab rides.
But a significant fraction of that expenditure will go toward an expansion, funded by a recently imposed transit tax, that will increase the average number of buses in service by 70%. Will the future ridership increases retroactively justify that massive expenditure? To address that question we will base our model on the historical relationship between the numbers of buses on the streets and riders in the seats.
The model will necessarily be crude and based on somewhat-arbitrary assumptions, so we won’t expect its ridership projection to be anything like precise. But the exercise will convince us that ridership won’t increase nearly enough to justify the outlay. Specifically, the model will estimate that the ridership effect of the 150% local-subsidy hike represented by the transit tax will be less than 10%. Indeed, we will find that each bus ride added by the expansion could end up costing over $90 in transit tax.
Background
Two other taxpayer-funded organizations, namely, the Indianapolis Metropolitan Planning Organization (“IMPO”) and the Central Indiana Regional Transit Authority (“CIRTA”), joined IndyGo in a massive public-relations campaign to obtain transit-tax approval in a 2016 referendum. As part of the 70% service increase, they said, IndyGo’s conventional bus routes would be interconnected by a backbone of three all-electric bus-rapid-transit (“BRT”) routes, to be known as the Red, Purple, and Blue Lines. Coming every ten minutes, the BRT buses would travel in dedicated lanes and therefore whisk passengers to their destinations much more rapidly than conventional buses do. Because of the increased bus frequency, it was said, the expanded system would attract many residents who previously lacked the patience to wait for a bus or bother with bus schedules.
As our “Advocacy as ‘Educating’” post explained, though, the transit tax’s proponents tended to be evasive about just how much overall-ridership increase they expected. No one can reliably predict ridership with much precision, of course. But some basis for planning is necessary, and we know IndyGo employs models for that purpose.
Before the Red Line began operation, for example, IndyGo’s Web site said that its estimate of the Red Line’s initial ridership was “based on current demand and travel modeling.” And, when IndyGo personnel in a community meeting directed to the Purple Line were asked what the resultant ridership increase would be, they mentioned the ridership model they relied on.
But in neither case did IndyGo divulge its model’s actual estimate of the system-wide ridership increase. The only such projection Naptown Numbers is aware of appears in the city’s Thrive Indianapolis plan, which says that ridership after the expansion will be “at least 15% over 2016 levels.” Presumably that projection came from IndyGo, but as far as we’re aware no IndyGo spokesman has confirmed it publicly, and putting 70% more buses on the streets to attract only 15% more riders seems like a waste of resources.
The Data
To determine whether so small an effect is actually likely we consult Federal Transit Administration (“FTA”) data. Going back to 1991, they include annual values for IndyGo’s ridership and its “vehicle revenue hours,” which is the the average number of buses in service multiplied the number of hours in a year. And what those data suggest is that if anything the 15% figure given by Thrive Indianapolis is optimistic.
Take 2019, which was the last pre-pandemic year. According to the FTA data, service on IndyGo’s main, fixed-route system had already increased by 14%, to 591,047 vehicle revenue hours from 2016’s 518,142. Moreover, bus rides were free system-wide for two weeks that year to publicize commencement of Red Line service. And rides were free on the Red Line itself for three full months. Yet that year’s ridership, 9,235,684 bus rides, exceeded 2016’s 9,193,293 by less than half a percent. This implies that the elasticity, or ratio of percentage changes, is only about 0.03. With that elasticity the 70% service increase would change ridership by only 2% even without the pandemic’s negative influence.
Of course, we can’t base our assessment on only a single interval. Confounding factors such as gasoline prices, financial crises, weather, vagaries in IndyGo execution, and Indianapolis events like the 2012 Super Bowl can make ridership’s service elasticity appear higher or lower than it otherwise would. Our model won’t attempt to account for most such factors; we’ll just hope that over time they average out.
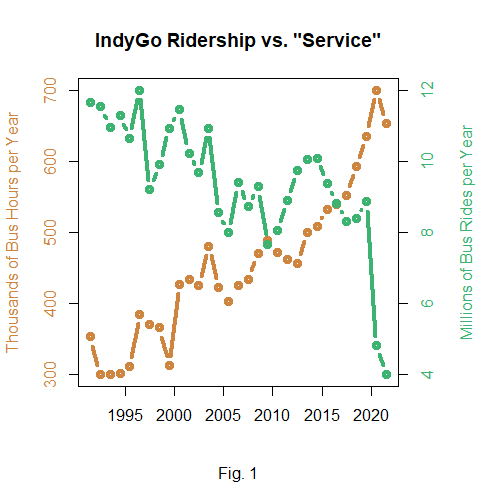
But there’s one factor that we won’t ignore. Even if we exclude the pandemic years we find that the elasticities implied by most intervals actually seem to be negative; as the plot above shows, a secular decline in ridership accompanied a secular increase in service. This could lead to the improbable conclusion that adding buses reduces ridership.
Propensity to Ride
So in our model we’ll assume a secular decline in Indianapolis residents’ propensity to take the bus. We might speculate, for example, that much of that secular trend results from the fact that as time has gone by households on the bus routes have become smaller and/or more able to afford cars, so in essence people have left the market for bus rides.
We don’t know the magnitude of this effect, so we’ll just make an assumption: that the rate at which potential riders leave the market is proportional to the number of them still in it. If that proportionality is constant, as we’ll assume for the sake of convenience, then by definition the relationship with time is exponential. If nothing else changed, that is, we assume ridership R would decay exponentially with time t:

where the half-life τ is the time required for ridership to fall by half.
IndyGo’s Ridership Model
It will not have escaped the reader’s attention that we have just made assumptions based on nothing but intuition and convenience. But for all that’s apparent this distinguishes our model from very few whose outputs drive policy decisions every day.
Take the model on which IndyGo based its estimate that the Red Line’s initial ridership would be about 11,000 per day, or 83% more than the 6,000 trips per day then taken in the corridor the Red Line would serve.

As Fig. 1 illustrates, the Red Line has never averaged the predicted level, even in its initial three months, when rides were free and it enjoyed great press publicity. Once fare collection started, the Red Line’s paid ridership never averaged even the 6000 that conventional buses had previously carried in its corridor.
For the two years after the pandemic’s onset, moreover, ridership averaged less than a quarter of what referendum voters had been told it would. True, ridership rallied somewhat after the mask mandate was lifted in April, particularly when gas prices spiked in June. But even then its monthly average rose to only 33% of the promised 11,000 daily riders. And that may have been just a dead-cat bounce; October, historically a high-ridership month, saw only 21% of the promised level.
Yes, our model employs guesswork. But so does IndyGo’s. The difference is that we’re transparent about how we make the guesses.
Elasticity
Now, it’s reasonable to suspect that IndyGo’s service increase made its ridership decline less than residents’ diminishing propensity to ride would otherwise have made it. Our goal is to estimate that effect’s magnitude. In teasing that service effect out of the secular decline we’ll make another assumption. Specifically, we’ll assume for the sake of mathematical convenience that IndyGo ridership’s service elasticity is constant and independent of service and ridership.
As we said before, ridership’s service elasticity ε is the ratio between the relative changes in ridership R and service S. More precisely for our purposes, elasticity will be taken to be that ratio’s limit as the relative changes approach zero. The (infinitesimal) relative changes are therefore dR/R and dS/S, so the value of ridership’s service elasticity ε is given by

which is a differential equation whose solution since ε is independent of R and S is given by

Combining that relationship with the above-assumed exponential decline in Indianapolis residents’ propensity to ride gives us the following ridership model:

where k is a proportionality constant.
70% More Buses to Attract Only 8.8% More Riders
With this model in hand we estimate IndyGo ridership’s service elasticity by finding the combination of parameters k, τ, and ε that minimizes the mean squared error between the modeled and actual ridership values. An elasticity of 0.158 (and half-life of 61 years) results from so minimizing that error as to produce the following fit:

Obviously, the model fails to capture the exogenous factors we mentioned above. To the extent that such factors’ effects are short enough in duration as not excessively to confound the secular relationship between service and ridership, however, the elasticity value ε = 0.158 we obtained tells us that the ridership effect of a 70% service increase would be only 8.8%:

It’s entirely plausible, that is, that even Thrive Indianapolis’s seemingly modest claim of at least a 15% ridership increase will prove to be optimistic.
The above plot’s two rightmost, solid dots represent resultant model projections to 2028, when the IndyGo expansion is supposed to be complete and perhaps the promised 70% service increase will actually have occurred. Based on such an increase over the referendum-year level, the upper dot represents 8.6 million bus rides on IndyGo’s main, fixed-route system. This is less than in the referendum year—and implies an average occupancy of only 3.2 riders per bus, much less than the referendum year’s already-meager 5.8.
More Expensive Than Cabs
If IndyGo’s van service provides, say, another 310,000 rides and we take the $111 million figure from IndyGo’s 2021 financial report as 2028’s local-tax total, then by adding $1 per ride in fares we find that the projected cost of providing an average ride is about $13.40—even before state and federal subsidies.
That’s more expensive than taking cabs. A cab ride of the IndyGo-average 4.5-mile length costs about $14 with tip, but cabs sometimes carry more than one passenger. Let’s say that 18% of cabs carry two passengers, 5% carry three, and 2% carry four. On average that would come to $10.50 per passenger, nearly $3 less than what IndyGo rides will cost in local subsidies and fares alone.
$92 per Added Ride?
Although the model says IndyGo’s ridership will be less in 2028 than it was in 2016, it also says that without the service increase the ridership would be even less.
But not much less.
Based on no increase over the referendum-year service level, the lower solid dot’s value is only about 692,000 rides less than the upper solid dot’s.

Fig. 3 illustrates the result in terms of local taxes. Dividing the ridership difference into the $64.1 million in transit tax tells us that each expansion-added bus ride will cost nearly $92 in transit tax.
Conclusion
Again, that projection is based on some unsupported assumptions—to which marginal values like cost per added ride are particularly sensitive. The foregoing exercise nonetheless suggests that even in terms of only readily tracked local taxes an IndyGo ride’s cost may never again average less than cab rides do. As we will see in our next post, moreover, the taxes depicted in Fig. 3 represent only part of the subsidy burden. That post will also tell why our seemingly pessimistic projection may actually prove to have been optimistic.
See p. 35 of IndyGo’s budget book.
See p. 6 of IndyGo’s capital plan.