


Advocacy as "Educating"
A Case Study in Taxpayer-Supported Obfuscation
A moment of levity occurred in a recent Indianapolis City-County Council committee meeting. The CEO of IndyGo, as the local bus company is known, managed to say with a straight face that “IndyGo is only allowed to educate, we’re not allowed to advocate.” The resultant laughter served as a reminder of why we need limitations on government: government-funded advocacy has made the citizenry too vulnerable to being duped by special interests.
Background
The committee meeting dealt with fallout from a 2016 transit-tax referendum that a recently enacted statute had provided for. According to the statute, the Council could impose a transit tax under certain conditions if a referendum granted the Council that power.
The resultant referendum’s language was:
“Shall Marion County have the ability to impose a county economic development income tax rate, not to exceed a rate of 0.25%, to pay for improving or establishing public transportation service in the county through a public transportation project that will create a connected network of buses and rapid transit lines; increase service frequency; extend operational hours; and implement three new rapid transit lines?”
IndyGo’s fixed-route bus system was the “public transportation service” that the tax would “pay for improving or establishing.” According to the Federal Transit Administration (“FTA”), “Bus Rapid Transit (BRT) is a high-quality bus-based transit system that delivers fast and efficient service that may include dedicated lanes, busways, traffic signal priority, off-board fare collection, elevated platforms and enhanced stations.” IndyGo had no BRT lines at the time of the referendum, and combining a few of its existing routes into three BRT lines would convert the existing IndyGo network into “a connected network of buses and rapid transit lines.”
The referendum passed in 2016, the government started collecting a 0.25% income tax in 2018, and in 2019 service began on the first BRT route, the Red Line. But IndyGo didn’t abide by the statutory conditions, namely, that “the public transportation corporation shall establish fares and charges that cover at least twenty-five percent (25%) of the operating expenses of the urban mass transportation system operated by the public transportation corporation” and that “at least ten percent (10%) of the annual operating expenses of the public transportation project must be paid from sources other than taxes and fares.”
In response to the Council’s thus flouting the law, a bill has been introduced into the General Assembly that would impose penalties for failing to enforce those conditions. It would also place restrictions on the use of dedicated lanes; as Naptown Numbers has previously explained, IndyGo’s planned use of such lanes makes no sense.
Advocacy, Not Education
IndyGo CEO Inez Evans’ education-not-advocacy comment came when a councilor asked what could be done to defeat the bill. What made it funny is that advocacy, which consists of arguing favorable facts and withholding less-congenial ones, is precisely what IndyGo had been doing for years under the guise of “educating.”
In particular, while less than one Indianapolis resident in thirty rode a city bus even once a year, a massive pre-referendum campaign by IndyGo, the Indianapolis Metropolitan Planning Organization (“IMPO”), the Central Indiana Regional Transit Authority (“CIRTA”), and others created the impression that the transit tax would change all that. “The current ridership on the [Red Line] corridor is 6,000 trips per day,” IndyGo’s Web site said, but it predicted an 83% increase: “Based on current demand and travel modeling, initial, conservative estimates show approximately 11,000 trips per day will be made via the Red Line.” What’s more, “Ridership is expected to grow over time as a result of increasing population and employment in downtown and adjacent areas.”
Thus focusing on the BRT line but withholding IndyGo’s estimate of system-wide ridership was an exercise in advocacy; BRTs tend to attract most of their ridership by cannibalizing other routes. Beyond that, the BRT-ridership prediction itself was probably an exaggeration. The pandemic has understandably made ridership fall short of the predicted 11,000. But even before the pandemic no month averaged even half that many paying riders.
IndyGo is now walking its prediction back, and not candidly. It has quietly changed its Web-site wording, and in the committee meeting IndyGo CEO Inez Evans said, “If you look at our Web site, it’s very clear that that number was the assumption when the full grid-system network would be in place. That included the entire network: Purple, Blue and the Marion County Transit Plan all wrapped into one.” Such a statement was advocacy, not education. Few who read the original wording could possibly have taken it to mean what Ms. Evans now claims is clear.
Indeed, even the new wording (found in the “Operations” item on the Red Line’s detailed-information page) isn’t the model of clarity she seemed to imply. It now omits “via the Red Line.” And the specified date, namely, “[w]hen IndyGo transitions from its existing hub and spoke system to an efficient Grid system in June 2020,” has already passed. That Web page’s confusing word salad gives the impression that IndyGo would have expected to reach 11,000 by last summer if the pandemic hadn’t intervened. An Indianapolis Business Journal piece published on the eve of the Red Line’s opening reinforces that interpretation.
Had IndyGo been educating rather than advocating it would have presented both sides of the issue. It would have provided a realistic ridership-increase estimate for the overall system, not just an exaggerated one for a BRT line.
Carbon-Dioxide Emissions
It would also have worked to dispel some common misconceptions. Consider in that connection one of the measures for “achieving carbon neutrality by 2050” in Indianapolis mayor Joe Hogsett’s Thrive Indianapolis plan: “Through equitable redesign, extended hours and completing construction on the bus rapid transit lines, IndyGo will increase transit service by 70% and increase ridership by 15%” over 2016 levels.
The belief that reduction of Indianapolis’s “carbon footprint” would result from expanding IndyGo probably arose from things like the IndyGo tweet that included the following bar plot:
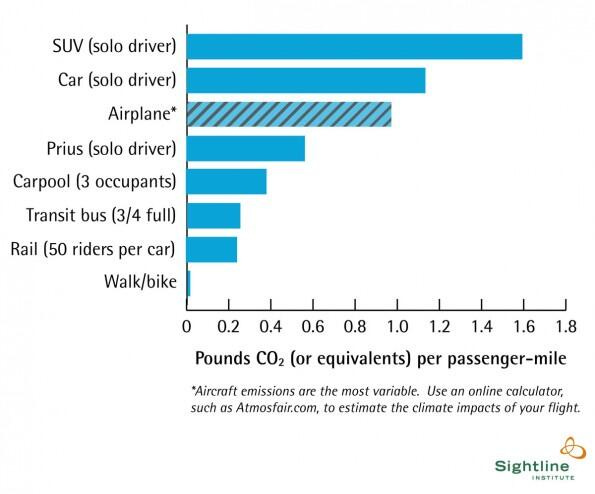
That plot is false and misleading. Given that gasoline combustion emits 19.6 pounds of carbon dioxide per gallon and that a Prius gets more than 50 miles per gallon, for example, the Prius value should be less than 0.4 pound per mile. More to the point, the plot gives the impression that city buses emit less carbon dioxide than cars do, whereas the Alternative Fuels Data Center (“AFDC”) says just the opposite.
The chart’s misleading value for buses is based on the assumption that city buses are three-quarters full. But according to FTA records it took IndyGo 6,997,279 “revenue miles” in the referendum year to provide 40,501,760 passenger miles: IndyGo bus occupancy averaged only 5.8 passengers. This implies that IndyGo’s emissions per passenger mile were high.
Specifically, the AFDC says an average city bus gets the equivalent of 3.26 miles per gallon of gasoline. Diesel fuel’s heat of combustion is 1.11 times as great as gasoline’s, so let’s call that 3.63 miles per gallon of diesel fuel. Diesel-fuel combustion emits 22.4 pounds of carbon dioxide per gallon. So IndyGo’s 5.8-passenger occupancy means it would have emitted about (22.4 ÷ 3.63 ÷ 5.8 ≈) 1.07 pounds of carbon dioxide per passenger mile if its buses had all been powered by diesel fuel.
IndyGo reported that 179 of its 200 buses were diesel and the rest electric. Given electrics’ range, though, it’s unlikely that they accounted for even 10% of IndyGo’s bus miles. So we’d expect an average of at least 0.95 pound per passenger mile if IndyGo’s mix of bus makes and sizes matched the mix the AFDC values are based on. Since it probably didn’t match exactly, we’ll somewhat arbitrarily consider the range of likely IndyGo emissions rates to be bounded by the all-diesel value, 1.07 pounds per passenger mile, and the 0.77 pound per passenger mile we’d get by assuming that the buses were all powered instead by compressed natural gas (“CNG”).
Together, the AFDC vehicle- and passenger-mileage values imply that average car mileage is 24.2 mpg and occupancy is 1.7, which would mean only 0.4 pound per passenger mile. But here we’ll assume a lower occupancy, 1.25, for the types of car trips that bus rides might displace, and we’ll estimate that city mileage is only 85% of the national average. That works out to 0.76 pound per passenger mile, which falls below the range we estimated for IndyGo. So Indianapolis without IndyGo would probably have emitted less carbon dioxide than it did with IndyGo even though shuttering IndyGo would have ended up putting (a very few) more cars on the streets.
What about Electric Buses?
The BRT-line buses will be electric, and electric buses cause less carbon-dioxide emission than CNG or diesel. That confuses the issue because what we’re interested in is the effect of the expansion, i.e., of lengthening IndyGo’s operating hours and increasing its bus frequency. There’s nothing about electrics that requires either. For electric buses, in fact, it would be better to shorten the hours, because electric-bus range tends to be inadequate when operating hours are long. But it will be instructive to calculate how much carbon-dioxide emission IndyGo would have caused if its buses had all been electric.
To charge those buses AES Indiana would have had to burn coal and natural gas and therefore emit carbon dioxide. Exactly how much it would have had to burn is unclear because purveyors of “green” products tend to exaggerate, so reliable numbers are hard to come by. It’s been said, for example, that electric buses require only 1.7 kilowatt-hours (“kWh”) of electricity per mile. But that figure is difficult to credit in light of IndyGo’s experience.
Specifically, IndyGo-bus range tests described in an Indianapolis Business Journal article averaged 206 miles, and it’s been reported that each IndyGo electric bus can store 642 kWh. That range and storage capacity are consistent with the 160.2-mile range reported when that bus model’s prototype was tested with only 520 kWh of storage. The tests consumed about 93% of the bus’s total storage if the example mentioned in the article is representative. Dividing that by the average range yields 2.9 kWh/mile.
To determine the resultant emissions we’ll use Oak Ridge National Laboratories’ estimate that heat-transfer, energy-conversion, and electricity-transmission losses end up making a kilowatt-hour at the socket require 9104 British thermal units (“BTUs”) of combustion heat at the power plant. AES Indiana projects that by 2023 its energy-source mix will be 47% natural gas, 28% coal, 15% solar, and 11% wind, reducing the heat rate to 2524 BTU/kWh and 4237 BTU/kWh, respectively, from coal and natural gas. Since coal and natural-gas combustion respectively produce 210 and 117 pounds of carbon dioxide per million BTUs, that works out to 1.03 pounds of carbon dioxide per kilowatt-hour, or about 3.0 pounds per vehicle-mile.
If all routes had run electric buses of the type IndyGo uses on the Red Line, then they would have caused about a half pound of carbon dioxide per passenger mile, or 32% less than cars do. Moreover, not all of the electric buses would have been the sixty-footers IndyGo uses for the Red Line. Bus manufacturer Gillig, for example, claims its forty-footers consume only 2.3 kWh/mile. That would work out to 0.41 pound per passenger mile, or 46% less than an average car’s emissions per passenger mile (but more than a Prius’s 0.31 pound per passenger mile).
So perhaps an all-electric IndyGo would have prevented more carbon-dioxide emission than it would have caused. But that conclusion is not at all self-evident, because cars tend to take more-direct routes, and passenger surveys indicate that only half of IndyGo riders would otherwise have gone by car, taxi, or ride share.
So all this tells us is that converting to all electric buses would reduce IndyGo emissions. And, again, there’s nothing about electrics that requires expansion, so the emissions reduction that results from electrification is no reason to expand IndyGo.
Expansion Emissions
Instead, decisions such as whether to expand IndyGo are made at the margin, so what we’re really interested in the marginal value, i.e., how much more carbon dioxide must be emitted to provide the next passenger mile. To estimate that value we’ll ignore any conversions of existing diesel buses to electric (which could happen without expansion) but otherwise employ assumptions unrealistically favorable to IndyGo.
The Hogsett administration predicted that the ridership increase may be as little as 15% when the increase in annual revenue miles has reached IndyGo’s 70% goal. But we’ll instead assume the ridership will increase by 25%. The BRTs will be electric, but IndyGo’s recent experience with them suggests that much of the 70% revenue-miles increase will still be provided by diesel-powered buses. We’ll nonetheless assume that they’re all electric. We’ll further assume that they consume only the 2.3 kWh/mile that Gillig claims instead of the 2.9 kWh/mile implied by the reported Red Line bus tests.
We’ll assume, that is, that the added buses will cause only 2.4 pounds of carbon-dioxide emissions per vehicle mile instead of the 3.0 pounds that IndyGo’s actual electric buses cause or the 6.2 pounds that diesel buses emit. If we divide the product of that 2.4 kWh/mile and 70% of 2016’s 6,997,279 revenue miles by 25% of 2016’s 40,501,760 passenger miles we get 1.1 pounds of carbon-dioxide emissions for each added passenger mile. For IndyGo’s actual electric buses that value would be 1.4 pounds, and it would be 3.0 pounds for diesel buses.
Even the 1.1-pound-per-passenger-mile value exceeds cars’ 0.76. And IndyGo’s expansion will displace even less than 0.76 pound per passenger mile in car emissions, because something like half of the added passengers’ alternatives to the bus wouldn’t be to go by car. So even under those highly favorable assumptions expanding IndyGo would likely cause nearly twice as much carbon-dioxide emissions as it would prevent. Under more-realistic assumptions it would cause even more than that.
Had IndyGo really wanted to educate voters about the expansion’s likely effects, therefore, the plot it used would have been more like the following:
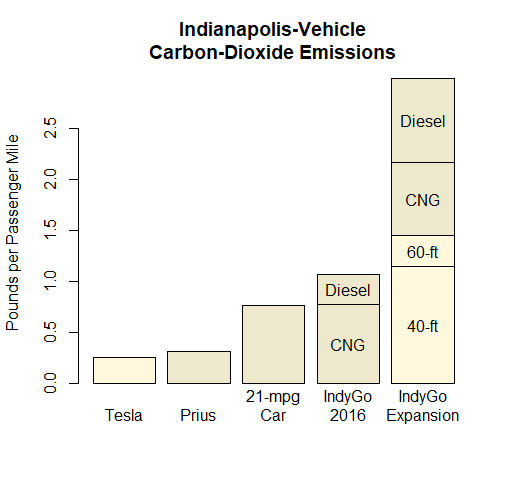
The right-hand bar represents marginal values based on the assumption that the expansion’s 70% increase in revenue miles will attract 25% more passenger miles. Its bottom segment’s value was calculated by assuming that all the added revenue miles are being provided by those forty-foot Gillig electrics. That bar’s other segments represent how much we increase that value by assuming that the added revenue miles are all provided by IndyGo’s actual electric buses, by CNG-powered buses, or by diesel-powered buses.
As the plot shows, the expansion’s marginal rate of emission exceeds the pre-expansion’s average rate, which in turn exceeds cars’ emissions. Even if it didn’t, the expansion might still increase Indianapolis’s “carbon footprint” because not all added bus passenger miles replace car passenger miles. If battery prices continue to fall, moreover, car emissions may trend toward the all-electric and hybrid values the first two bars represent.
None of this matches the impression that IndyGo’s “education” efforts created. And the Council showed little interest in dispelling the referendum electorate’s resultant misapprehension. Yet IndyGo continually points to the referendum outcome as residents’ endorsement of its (emissions-increasing) expansion.
A Pig in a Poke
Now, we based the preceding calculations on the assumption that IndyGo’s expansion will ultimately increase ridership by 25%. And the Hogsett administration predicted that the increase could be as low as 15%. What we haven’t discussed is what IndyGo itself thought the overall increase would be. That’s because IndyGo has never publicized its estimate as far as Naptown Numbers is aware.
It’s not as though IndyGo never had an opportunity to do so. Together with other tax-funded advocates and the local chamber of commerce, IndyGo must have made over a hundred presentations at meetings all around Indianapolis. Both before and after the referendum it also made multiple presentations to the Council to urge transit-tax passage. If any of those presentations included an estimate of the overall ridership increase, it received little publicity.
Consider how remarkable that is. IndyGo is a bus company. Its product is transportation. The Council was negotiating to buy more of that product. The price of about $55 million in transit tax was agreed to. But for all we know the Council never asked the most basic question: How much additional transportation would the city get for that $55 million? How many added passenger miles or at least bus rides would that $55 million buy? IndyGo was selling a pig in a poke, and the Council made taxpayers buy it.
We can’t be certain what the reason was for IndyGo’s reticence. But the following fact seems relevant. If IndyGo internally made the 15% prediction that Thrive Indianapolis later let slip, it was planning to charge taxpayers about $9 per added passenger mile. That’s nearly four times what we pay for cabs, over five times what Uber charges, and more than an order of magnitude greater than our typical cost of other transportation.
Consider a $200 plane ticket to New York, for example. That comes to $0.28 per passenger mile. A $30 Greyhound ticket to Chicago would be $0.16 per passenger mile. The fully loaded cost of personal-car transportation is something like $0.30 per passenger mile, depending on make and model, cost of fuel, type of driving, and occupancy. Some say car cost is more like double that, but even so it would still be less than a tenth of the added IndyGo transportation’s cost.
Even taxis would cost less than the added IndyGo transportation. Depending on the distance and the number of people who share it, a cab ride may cost about $2.40 per passenger mile. (That’s the value we get by applying a $3 pick-up charge, a $2 charge per mile, a $0.65 extra-passenger charge, and a 15% tip to a cab ride whose length is IndyGo’s 4.4-mile referendum-year average if we assume that a little less than one cab in five carries two passengers and just under one in twenty and one in sixty respectively carry three and four.)
If Uber and Lyft cost about a third less, that’s $1.60 per passenger mile. And $1.42 per passenger mile is the value that results from applying our cab-occupancy assumption to the $7.09 Uber quote Naptown Numbers recently obtained for the 4.4-mile trip from 49th & Illinois to 10th & Capitol.
If IndyGo really had been educating rather than advocating, or if the Council had really been interested in having an informed referendum electorate, the public would have been aware of such cost comparisons.
Uncertainty
Of course, we can’t be sure the ridership increase won’t exceed 15% or even the 25% we assumed for our emissions calculations. But we’re entitled to doubt that the increase will be large, if for no reason other than that IndyGo seems not to have seriously disputed the Thrive Indianapolis prediction.
Also, revenue-hours increases haven’t done much so far to increase ridership. In 2019 IndyGo not only logged 14% more revenue hours than in the referendum year but also inaugurated the Red Line in a flood of publicity, making fares free for a month system-wide and for three months on the Red Line. Its ridership that year nonetheless exceeded the referendum year’s by only 0.5%. If we project that value to the intended 70% revenue-hours increase we get a ridership increase of only 2.5%. That is, IndyGo is on track to see only one-sixth of the Hogsett-predicted minimum.
We can’t put much stock in that type of projection, of course, but the point is that evidence for an imminent quantum leap in ridership is hard to find.
Aid for the Poor
From IndyGo’s tweets about the Purple and Blue Lines you’d think there’s some huge pent-up demand from low-income people for more bus rides along those lines’ routes. But except for some small stretches those routes already have frequent service, so it’s unlikely that there’s very much unmet demand.
As a way to help the poor, moreover, expanding IndyGo is hideously inefficient. If the Council had been candid, it would have put the proposition to voters in the following way. We want to impose a tax that will raise about $55 million to help our low-income neighbors. Now, we could just split the $55 million up evenly, giving all low-income people $375 apiece that they could use for anything they want, like paying the gas bill or buying hearing-aid batteries. But that’s not what we’ll do. Instead, we’ll pay the whole $55 million to IndyGo, and in return IndyGo will provide less than two-and-a-half million bus rides it wouldn’t have otherwise.
Never mind that not all those added rides will be taken by low-income people. Or that three out of four low-income people still won’t take even a single bus ride in a year. Or that if each added passenger chipped in what he’d pay in bus fare the $55 million could subsidize about nine million Uber rides instead of less than two and a half million bus rides. (If the Thrive Indianapolis prediction proves true, the number of added bus rides will be only 1.4 million.)
Of course, that’s not the way it was presented. Instead, subsidy partisans often accused opponents of having no concern for the less fortunate. But what about the transit tax’s effect on the many modest-income residents who have to pay transit tax but never ride the bus?
Picture a Franklin Township kitchen table where a single mother is figuring out her budget. She’s deciding whether she can afford the one more math-tutoring session that might get her struggling son over the finish line. Although she pays only $40 in transit tax on the income she makes as a produce manager, that $40 would have made a difference if it had remained in her pocket. Instead, it buys as little as a single added bus ride—taken, for all we know, by a big-firm downtown lawyer who rides the Red Line from his Meridian-Kessler home.
And that lawyer would almost certainly not take the bus if the fare were the $40 that enticing him onto the bus costs taxpayers; such a fare would be three times the cost of a cab. Not only is the single mother forced to pay for a ride she doesn’t take, that is, but the amount she has to pay for it far exceeds what it’s worth even to the putative beneficiary.
IndyGo’s “education” sessions never pointed this out.
Congestion
Another misconception IndyGo took no pains to dispel was that expanding IndyGo would decrease traffic congestion. Even before the expansion IndyGo’s overall effect on congestion was minuscule. IndyGo provided only a half percent or less of the ten or twenty billion passenger miles annually traveled in Indianapolis. Given that IndyGo’s budget wasn’t much less than the city’s entire transportation budget, moreover, IndyGo’s overall effect may have been detrimental. How much congestion resulted from potholes that would have been filled if IndyGo hadn’t been a drain on the budget?
Apropos of which, IndyGo’s 5.8-passenger average bus occupancy meant that a fifteen-ton bus would have loaded the pavement with over two and a half tons of bus per passenger: more than the ratio for an F-150 crew-cab pickup and over twice the ratio for a Honda Civic. And, to the extent that IndyGo’s buses were relatively full on a few stretches, those lumbering behemoths traveled most of the network close to empty but still loading the pavement—and obstructing views of signs and traffic, crowding inter-lane space, requiring other traffic to back up at intersections where they turn, and generally making nuisances of themselves.
So it’s not clear that before the expansion IndyGo’s overall effect on traffic congestion was even a little beneficial. And expanding IndyGo is fairly certain to make congestion worse. A previous piece demonstrated that congestion increases will result from the BRTs’ dedicated lanes. Given that so many added bus miles are unlikely to attract many added riders, moreover, the expansion would likely increase congestion even if IndyGo weren’t appropriating lanes.
This can be seen by dividing 25% of 2016’s 40,501,760 passenger miles by 70% of 2016’s 6,997,279 revenue miles. The result is less than 2.1 passengers for each added bus on the streets. Again, only about half of bus riders would otherwise go by car, cars tend to take more-direct routes, and car occupancy may be something like 1.25. So the number of fifteen-or-more-ton buses the expansion adds to the streets may exceed the number of two-ton cars it displaces. It will definitely exceed that number if the ridership increase turns out to be the 15% Thrive Indianapolis value. And some of those buses will weigh nearly thirty tons, not fifteen.
This is not the impression that IndyGo’s advocacy tended to convey.
Faster Trips
One of the selling points in the run-up to the referendum was that dedicated lanes would enable BRT buses to zip to their destinations much faster than mixed-traffic buses can. IndyGo’s BRT service standards, for example, put the average-speed goal at 25 miles per hour. That’s much greater than the 17-mile-per-hour goal for its fastest category of mixed-traffic service; it would knock five minutes off a fifteen-minute bus ride. And in an Indianapolis Business Journal piece IndyGo appeared to be sticking to this 25-mile-per-hour story as late as a week before the Red Line started operation.
If experience since then is any indication, IndyGo over-egged the pudding. The Red Line is currently scheduled to take 50 minutes to travel its 13.1-mile route. The 15.7 miles per hour thereby implied is a respectable city-bus speed, but it’s not 25 miles per hour. Indeed, it doesn’t even meet the 17-mph standard for frequent non-BRT service.
In fairness, not all of the 13.1-mile Red Line consists of dedicated lanes. And on February 26th its 9.5-mile dedicated-lane stretch (from 66th Street & College Avenue to the Downtown Transit Center) took a 7:00 AM Red Line bus only 34 minutes, which works out to 16.8 miles per hour. Still, the next bus on that stretch took 38 minutes: 15.2 miles per hour. Again, that’s respectable. But it’s not impressive in comparison with the 16.5 miles per hour implied by mixed-traffic Route 39’s 24-minute scheduled duration for the 6.6 miles between Franklin Road and Central Avenue.
So the Red Line isn’t exactly slow, but it hasn’t provided anywhere near the travel-time reduction voters may have expected. Perhaps the Purple and Blue Lines will do better; their routes are somewhat different. But nothing in IndyGo’s record gives us much reason to expect that they will. Even if they do, a previous piece pointed out, the time bus riders gain will almost certainly be swamped by the amount of time travel-lane loss costs motorists.
The Information Wall
Information such as we’ve seen here would have been hard for a referendum voter to find. The barrage of pro-subsidy advocacy by tax-supported organizations tended to drown it out. Even some councilors were complicit. And rumors that IndyGo or its supporters were actively working to prevent neighborhood groups from hearing opposing viewpoints seem credible in light of what happened when a little information did get through.
In response to concerned citizens’ inquiries, transit expert Randal O’Toole performed an analysis of how poorly the dedicated-lane concept fit Indianapolis. Dr. O’Toole’s opinion was that “the number of people who the new buses will attract who aren’t already riding transit is trivially small” because Indianapolis is not as dense as the few cities where transit really plays an important role. In Wendell Cox’s comparison of central business districts, for example, Indianapolis has less than a third as many downtown jobs.
But the local newspaper’s article about Dr. O’Toole’s work went off on a tangent about how drawing the downtown-area lines in a different manner would have yielded a higher Indianapolis job number—as if drawing them differently wouldn’t have increased the other cities’ numbers, too. Entitled “Foes try to puncture Red Line claims,” it also cited studies espousing the transit-oriented-development theory but failed to mention the causality problems that afflict such studies. And, although it did report that Dr. O’Toole was critical of the theory, it omitted the reasons why he considered it a delusion.
Elsewhere a stunningly shallow and dishonest hit piece by local pundit Sheila Kennedy called Dr. O’Toole “a propagandist, not a researcher.” Now, Naptown Numbers believes that Dr. O’Toole erred in proportioning energy expenditures to bus mass. But his research’s data sourcing was meticulous. Even though his analysis explicitly cited the power company’s fuel-mix goals, moreover, Ms. Kennedy falsely accused him of not taking the fuel mix into account.
Having apparently fallen for IndyGo’s story, she also contended that “IndyGo has access to solar arrays to power its electric fleet.” The amount of emissions that IndyGo’s solar panels spare the power company actually is almost independent of whether buses are running. In other words, the added emission that bus charging causes differs little from what it would be if IndyGo had not installed those solar arrays.
Conclusion
Like the reader who pathetically thanked Ms. Kennedy for “doing such a good job of researching,” most voters with day jobs can’t spare enough time to see through the appalling innumeracy that fills our newspapers, television, and punditry generally. And the committee meeting that Ms. Evans’ comment enlivened serves as a dispiriting demonstration that democracy isn’t well designed for choosing representatives who can see through it for them.
Elections more often favor candidates of the type who can bring themselves to believe that the Franklin Township produce manager’s $40 is better spent on a single bus ride for, say, a big-firm lawyer than on tutoring her son. And such candidates also tend to be eager to impose such beliefs on others.
The Republican-controlled Indiana General Assembly’s effort to rein in a profligate Council has been criticized as violating subsidiarity, i.e., as not leaving decisions to the most-local level practicable. But the most-local level practicable in this case is the kitchen table where an Indianapolis resident decides how best to allocate scarce resources among transportation, food, and other needs.
When taxpayer-supported advocacy and a supine press make it so hard to hear both sides of the issues, it’s particularly important that the General Assembly act to defend individual citizens against the tyranny of an misinformed majority. By this measure the bill that the Council would oppose doesn’t go nearly far enough.