


Another IndyGo Stiff-Arm
Ridership Reticence Redux
In a March 8, 2023, meeting Inez Evans, the CEO of the Indianapolis Public Transportation Corporation (“IndyGo”), stiff-armed another attempt by the Indianapolis City-County Council’s Municipal Corporations Committee to have IndyGo tell the public what its Red Line ridership has been. The incident was reminiscent of her performance at the meeting that Ridership Reticence reported. In that meeting Ms. Evans stated that ridership had been “up 30% compared to the ridership numbers from last year.”
That answer had been incorrect. Up to that point in the year the Red Line’s 2022 ridership had exceeded the corresponding 2021 value by 22.8%, not by 30%. And thereby making the comparison with only the early portion of 2021 was misleading; the populace had become increasingly vaccinated as 2021 wore on.
More important, Ms. Evans’ 30% figure gave no indication of how Red Line ridership had compared with the 11,000-per-day “conservative” prediction it made in its 2016 campaign for a nearly 150% local-subsidy increase. When she was accordingly pressed for that comparison, moreover, she avoided making it in public: “I don’t have those specific numbers in front of me, sir, but we can definitely get those back to the Council.”
Now, a naïve observer might therefore have expected Ms. Evans to arrive more prepared at the March 8th meeting. But she didn’t. This time she didn’t even give a percentage. When asked about Red Line ridership she merely said that it was “significantly up” but that “I don’t have the exact numbers, so I’ll e-mail them to you.”
Her refusal to state even a percentage publicly can perhaps be explained by the fact that now she had the whole of 2022 to compare, so to be honest she’d have had to admit that 2022’s performance was only 13% higher than the previous, pandemic year’s. Again, moreover, the year-over-year percentage still wouldn’t have told us much. As Councilor Brian Mowery observed, “I don’t think [Red Line ridership] had much room to go anywhere else but up.”

More meaningful would have been the fact that putting the pandemic in the rear-view mirror had increased ridership only from 22% of the promised 11,000 per day to 24%. As the plot above1 illustrates, the Red Line’s performance has fallen far short of expectations.
So Ms. Evans continued her practice of deflecting attention from IndyGo’s actual business and of instead indulging in counterfactuals. Specifically, she contended that over $2.5 billion of Indianapolis development is occurring “because of public transportation.” Transit-subsidy advocates frequently say this kind of thing—with little real evidence in support of the proposition that most of the development wouldn’t otherwise have occurred.
It’s absolutely true, of course, that access to transportation attracts development. To a very great extent the wealth we enjoy results from economies of scale that are possible only to the extent of markets that depend on transportation. And a city’s effectiveness as a market for selling one’s labor depends a lot on mobility, which is sometimes expressed in terms of how many jobs are reachable within, say, forty-five minutes. As we explained elsewhere, though, cars afford much more mobility than city buses do. That’s no doubt why Indianapolis residents choose cars over buses for all but a fraction of a percent of their transportation.
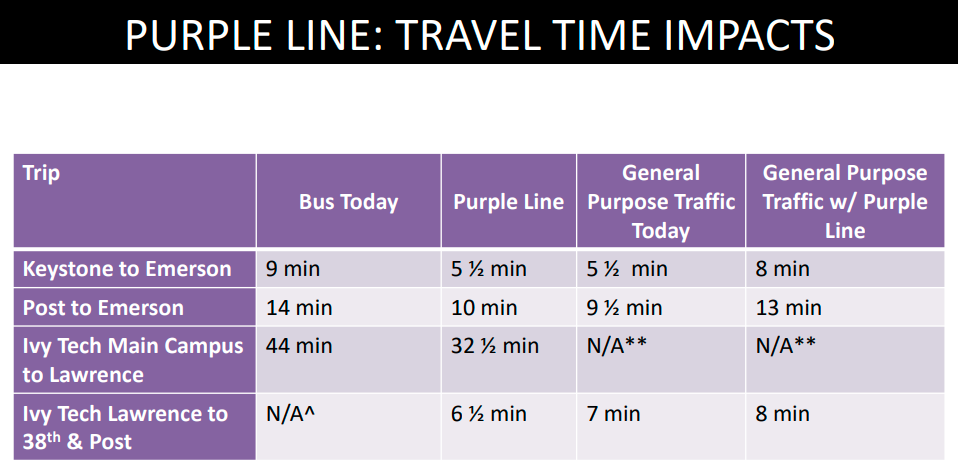
And IndyGo’s own numbers suggest that its transit-tax-enabled bus-rapid-transit routes (“BRTs”) will actually result in a net mobility loss. The four minutes per passenger saved by a few Purple Line riders between Post Road and Emerson Avenue will be swamped by the 3.5 minutes apiece lost on that stretch by several times as many motorists.
So any development IndyGo may cite as occurring near its BRT routes provides scant evidence that IndyGo is having a positive effect on development. IndyGo has no way of proving that more, better development wouldn’t have occurred without the traffic complications the BRTs cause.
What the public needs to see are fewer evasions and pointless videos and more facts relevant to IndyGo’s actual business: moving people. A recent report of the Federal Transit Administration, for instance, says IndyGo burned through $103,163,616 to provide only 24,355,626 passenger-miles. That’s $4.24 per passenger-mile: easily half again the cost of taking cabs.
At Mr. Mowery’s request the Committee has now invited IndyGo to attend its next meeting, too, but this time to be better prepared to report information actually relevant to IndyGo’s core business. Maybe this time Ms. Evans will be more forthcoming than she’s been so far.
As originally published, the plot’s y-axis legend incorrectly read “rides per month” instead of “rides per day.”