


Ridership Reticence
Why We're Less Astute As Voters Than We Are As Consumers
Introduction
Although frequently looked upon as blind hostility to government, the desire to limit government meddling in markets is more often a logical, pragmatic response to readily observed aspects of human behavior. One such aspect is that, however poor the decisions may sometimes be that we make as consumers, they tend to be better-informed than the decisions we usually make as voters. A related aspect is that having voters get the information that would enable them to exercise the franchise most intelligently isn’t always in the personal interests of those who are best positioned to provide it.
The latter aspect was in evidence at a September 2022 meeting of the Indianapolis City-County Council’s Municipal Corporations Committee. In that meeting the following colloquy took place between Councilor Brian Mowery and Indianapolis Public Transportation Corporation (“IndyGo”) CEO Inez Evans:
Mr. Mowery: “Where are we with ridership on the Red Line compared to what our goal was?”
Ms. Evans: “It has not reached its goal, but the ridership is up 30% compared to the ridership numbers from last year.”
Mr. Mowery: “With all due respect, if I had a hundred people thirty percent would be thirty more people. . . . Where are we at?”
Ms. Evans: “I don’t have those specific numbers in front of me, sir, but we can definitely get those back to the Council.”
Ms. Evans’ answer was misleading. Up to that point in the year the Red Line’s 2022 ridership had exceeded the corresponding 2021 value by 22.8%, not 30%. And, since the populace became increasingly vaccinated as 2021 wore on, the increase based on whole years is unlikely to exceed even half that 30%.
More to Mr. Mowery’s point, Ms. Evans didn’t answer the question he’d actually asked. As our previous post’s Fig. 2 shows, the correct answer would have been that the Red Line’s 2022 ridership was averaging only about a quarter of its 11,000-per-day goal. It’s hard to believe that neither IndyGo’s CEO nor its CFO, who was sitting right next to her, knew this answer to that frequently raised question.
Given IndyGo’s lack of candor about so important a performance measure, the average resident might be forgiven for failing to recognize the budget numbers’ implication: that at least for the next five years IndyGo will probably spend far more per city-bus ride than even someone who could easily afford it would be willing to pay to take the bus. This post will therefore do that math. In the process we will see that our previous post, which estimated that the IndyGo expansion’s marginal cost will be an appalling $92 in transit tax per added bus ride, may actually have been optimistic.
The Campaign
But first we’ll review how a bus company that serves less than one resident in thirty came to spend more than the city’s entire public-works department.
Indiana’s local governments didn’t always have the power that the Indianapolis City-County Council now has to impose a 0.25% transit tax on its residents’ personal income. But IndyGo’s excuse for its low ridership had been that its subsidy was too low to support the necessary bus frequency. So in 2014 the Indiana General Assembly granted the Council that power.
True, the General Assembly also required that an Indianapolis referendum approve the tax first. As Indiana Policy Review Foundation adjunct scholar Andrea Neal wrote at the time, however:
A referendum sounds fair, but won’t be. Mass-transit advocates have at their disposal tax dollars to finance their campaign. TV and radio spots running now are paid for by the Federal Transit Administration, whose mission is to support public-transit development. Ordinary citizens can’t fight this.
Ms. Neal turned out to be exactly right. Together with two other taxpayer-funded organizations, namely, the Indianapolis Metropolitan Planning Organization and the Central Indiana Regional Transit Authority, IndyGo mounted a massive pro-tax campaign that drowned out more-sober voices.
Their campaign was a barrage of half-truths. They were trivially correct, for example, to say that “when a transit system is improved to provide more reliable, more frequent, and more convenient service than was previously available, more people use it.” But the factoid they cited in support was misleading as to how significant that effect was likely to be:
In 2013, the City-County Council invested $6 million to reduce the time between buses on Routes 8, 10, and 39. As a result, the number of trips on those routes increased by 8.4% from 2012-2014, and in 2013 and 2014 ridership on the IndyGo system reached record numbers.
IndyGo ridership can be said to have “reached record numbers” in 2013 and 2014 only if all ridership before 2004 is ignored. And by that measure a record was also reached in 2012, before the $6 million “investment”; the country was recovering at the time from the financial crisis that had begun four years before.
More important, the pro-tax campaign omitted the fact that the $6 million amounted to more than $19 per added bus ride. As consumers most residents would never have spent so extravagantly on a city-bus ride. But as voters they lacked enough information to recognize how badly thus expanding the system squandered resources.
Then there was the argument for bus rapid transit (“BRT”). If voters approved the transit tax, proponents said, IndyGo’s conventional bus routes would be interconnected by a backbone of three all-electric BRT routes, to be known as the Red, Purple, and Blue Lines. Coming every ten minutes, the BRT buses would travel in dedicated lanes and therefore whisk passengers to their destinations faster than conventional buses do. But again proponents left out the important part; they didn’t tell voters how much faster.
If they had wanted voters to be informed they could have told them how fast the BRT route was they’d cited as an example: Cleveland’s HealthLine. Residents would thereby have seen that BRTs aren’t necessarily very fast. In FTA data the HealthLine’s ratio of “vehicle revenue miles” to “vehicle revenue hours” had been 9.0 mph in 2015: less than the 13.7 mph that IndyGo’s conventional routes had averaged that year without BRTs. True, the 27 minutes that according to Google Maps the HealthLine now takes to travel the 4.9 miles from Public Square to University Circle implies 10.9 mph instead of 9.0 mph. But that’s still not as fast as IndyGo’s non-BRT buses had already traveled.
Residents were also told that together the three new BRT lines and the other, non-BRT routes would provide 70% more service than IndyGo had provided in the referendum year. What few seemed to notice was that the 70% service increase came at the cost of an almost 150% local-subsidy increase. Nor had proponents taken pains to explain that by the 70% “service” increase they just meant an increase in buses on the streets, not necessarily in actual riders in the seats.
To the extent that any voters noticed the distinction, moreover, they could well have thought that ridership would increase more than bus hours would. In one of the rare cases in which IndyGo divulged expected ridership it said that when the Red Line began operation its ridership would be 11,000 trips per day, or 83% more than the 6,000 that non-BRT routes had provided in the same corridor.
The Reality
The referendum measure accordingly passed in 2016, transit-tax collection began in 2018, and Indianapolis eagerly awaited the IndyGo expansion’s expected completion in 2021:

But 2021 has come and gone, and despite massive outlays IndyGo has realized little of that vision. Instead of the 70% more bus hours the expansion was supposed to bring, the average has recently been more like 13%. (Fig. 2 illustrates how selective IndyGo is in stating only that it “achieved a 38% increase in service (prior to COVID-19).”)

Additionally, the Purple Line is still at more than a year from completion, while the Blue Line is in serious trouble. The projected cost of the latter’s original design ballooned from the already exorbitant $220 million to more than $500 million. According to a news report, IndyGo has already eliminated one segment of that route. And not only won’t the remainder begin running before 2027 but when it does it won’t use the promised all-electric buses.
Only the Red Line is up and running. The stated reason for building the Red Line before the other BRTs was that “data proves it has the best potential for immediate success from a ridership, economic development, and federal funding standpoint.” The Red Line did initially attract some federal funding, but there’s no compelling evidence that its net effect on development will be significantly positive. And even before the pandemic its paid ridership never reached so much as half the predicted 11,000 per day.
The Red Line does use electric buses, but they don’t have the promised range. IndyGo rushed it into operation without a functioning fare-collection system. And three years of operation on the Red Line’s College Avenue stretch still haven’t enabled IndyGo to master the timing that was supposed to confine that stretch’s buses to their dedicated lane. After losing lanes to the Red Line, that is, motorists still have to share the remaining lanes with the Red Line’s sixty-foot behemoths.
Also, voters had been told that Red Line buses would come every ten minutes, but the actual interval is fifteen, and the Red Line’s on-time performance is consistently poorer than the non-BRT routes’. Despite its dedicated lanes, moreover, its speed exceeds the system average by less than a single mile per hour. So when the bus does come its meager speed advantage cuts less than 40 seconds off the Red Line’s 15-minute average ride.
Then there’s the damage those massive buses cause. “Less than three years after project completion,” reported WRTV, “IndyGo says they are ripping up existing pavement at Red Line stations and doing it all over.” To that end, said WIBC, “IndyGo is planning to shut down North Meridian Street for approximately 30 days on Nov. 7 for planned improvements on the Fall Creek/Ivy Tech Red Line Station.” “IndyGo blames wear and tear on the weight of the 60-foot electric buses running repeatedly over the same routes seven days a week.” (Given that pavement wear seems to increase approximately as the fourth power of weight per axle, it would probably take over a thousand cars to inflict the damage that a single Red Line bus causes.)
The Pandemic
Obviously, the need for all that repair work can’t be blamed on the pandemic. Nor is the pandemic exclusively to blame for lengthening the project from five to at least eleven years. But with respect to ridership the plot below does suggest a troubling effect the pandemic may be responsible for.
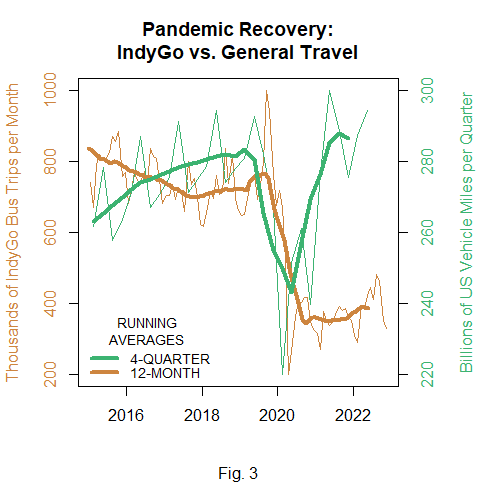
Fig. 3’s green curve shows that most travel recovered smartly from the pandemic, whereas its brown curve reveals that IndyGo ridership still barely exceeds half the value it had in the referendum year. This lackluster rate of recovery raises the possibility that some of the pandemic’s ridership effect may be permanent. Perhaps the pandemic taught some businesses how efficient it is to have more employees work from home. And it may have made some residents more aware of welfare benefits and thereby less eager to find work. Both factors could prevent IndyGo ridership from recovering completely.
Now, IndyGo CFO Bart Brown did say at that meeting that “we are seeing an increase in passengers coming back and riding the bus, and we hope to get to pre-COVID levels in the next two or three years.” But his 2023 budget book doesn’t reflect any confidence in even that slow a recovery. It projects exponential fare-revenue growth, but only from $5,190,830 in 2023 to $6,309,486 in 2027, whereas the lowest fare revenue in the last ten pre-COVID years was $9,224,816.
Since IndyGo’s total fare revenue has averaged about a dollar per bus ride, that revenue projection might suggest that IndyGo doesn’t expect to provide much more than about 6.3 million bus rides even in 2027. True, IndyGo does seem to like claiming that fare revenue has exceeded the budgeted value, so IndyGo may actually expect to collect more than its budget predicts. But even if we extend the budget book’s implied exponential ridership growth to 2028 the resultant 6.6 million bus rides is still 2.0 million less than the 8.6-million-ride projection to that year based by our previous post on only pre-COVID data. And it’s 4.0 million less than the 10.6-million minimum implied by the Thrive Indianapolis plan’s prediction of at least a 15% increase over the referendum year’s ridership.
So, whatever Mr. Brown’s hope may be, his budget book suggests that what he actually expects is an enduring pandemic effect.
What the Budget Implies
To place the budget-implied 2023–2027 ridership values in context we’ll calculate how much subsidy the city’s taxpayers will be providing per bus ride. IndyGo’s accounting on this point is somewhat opaque, so as each year’s total local subsidy we’ll simply assume the $111 million that Table V of IndyGo’s 2021 annual report listed as that year’s total property and income tax.
The bus rides whose quantities we inferred above are only the ones that IndyGo’s main, “fixed-route” system provides. IndyGo also runs a small “demand-response” service consisting of vans that go where riders direct. As a rough stab at including van rides we’ll add 3% to the above-inferred regular-bus ridership values before dividing the resultant total-ridership values into the assumed local subsidy.

Fig. 4 depicts the quotients that result. Since we’re assuming a constant subsidy the implied exponential ridership increase causes the cost per ride to decline with time. But at the end of that period we still see that in local subsidies alone IndyGo rides will cost even more than cab rides and more than six times the fully loaded cost of going by car.1
The Big Picture
And let’s not forget that the costs depicted in Fig. 4 aren’t the entire taxpayer burden. Consider in this connection that something like 16% of federal gasoline tax is diverted from highways to transit subsidies even though mass transit provides less than 1% of the nation’s ground transportation. That means our gasoline taxes pay some 16 times as much in subsidies per transit-vehicle mile as they do in highway construction and maintenance per car or truck mile. So the federal funding IndyGo says it obtains in “grants” ultimately comes from taxpayers’ pockets.
It’s important to bear this in mind because about 97% of IndyGo's nearly $1.3 billion in operating2 and capital3 expenditures over the next five years will come from taxes of some sort rather than fares and miscellaneous non-tax revenue. That’s almost $3300 per Marion County household.
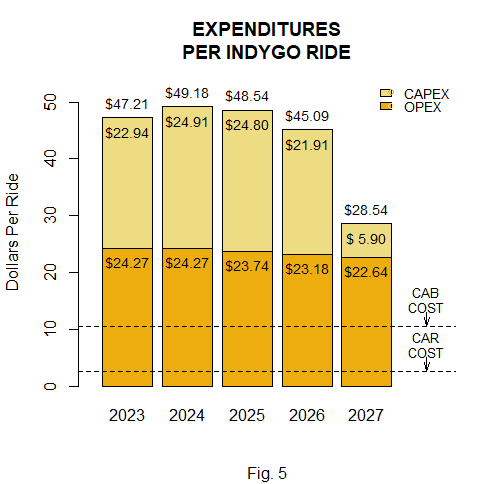
Fig. 5 depicts the results of dividing those planned expenditures by Fig. 4’s ridership assumption. Adding IndyGo’s operating and capital numbers together as that plot does isn’t strictly valid, because their accounting bases are probably inconsistent. But as far as we can tell the IndyGo operating-expense numbers we used don’t include depreciation, so we’ve probably avoided that source of potential duplication. Anyway, the point is that even after the expansion has been completed IndyGo expenditures per bus ride will exceed the cost of car travel by an order of magnitude and will even dwarf the cost of a cab ride.
IndyGo often argues that a lot of the capital expenditure over the next few years will go for sidewalks, sewers, and other infrastructure that can benefit residents who never take the bus. But there’s less to this argument than meets the eye. As “Stop Dedicating Lanes to Buses” pointed out, much of that expenditure goes instead to depriving motorists of street lanes and thus of mobility while increasing traffic on neighborhood streets. It’s not clear that the claimed benefits outweigh such detriments.
Moreover, much of the infrastructure work would have been unnecessary if IndyGo had just used conventional buses instead of those lane-hogging BRTs. And don’t forget the wasteful rent-seeking activity involved in obtaining those grants. It’s far from self-evident that residents receive a net benefit from federal funding.
Conclusion
Ms. Evans’ reluctance to divulge meaningful ridership information in a public forum is of a piece with the campaign of half-truths that has caused Indianapolis residents to be much more profligate as voters than they are as consumers. Had she wanted residents to be informed about the public corporation they’re taxed for, she would have been candid about not only IndyGo ridership but also its implication: that IndyGo costs taxpayers many times as much per passenger-mile as they’re willing to spend on their own personal transportation. (She might also have admitted that the right-sizing the would ensue if IndyGo subsidies were to end would reduce the Indianapolis carbon footprint.)
Ending those subsidies would put transit-expenditure decisions in the hands of consumers informed by more-accurate price signals rather than in those of voters misled by feeders at the public trough.
The $2.57 value we used as the equivalent car cost is probably high. To obtain it we first added 15% for inflation to the $0.62 cost-per-vehicle-mile value given for 2019 by the Bureau of Transportation Statistics. That value includes fuel and other operating expenses together with ownership costs including insurance, license, registration, taxes, depreciation, and finance charges. We then multiplied the result by the IndyGo-average 4.5-mile ride length and divided the product by an urban car occupancy of 1.25 passengers per average car. Although that doesn’t take road and street subsidies into account, we think such subsidies are more than offset by the fact that the government numbers are based only on new vehicles driven 15,000 miles a year for 5 years; obviously, many people buy used cars and/or drive their cars for more than 5 years before buying new ones.
See p. 35 of IndyGo’s 2023 budget book.
See p 78 of IndyGo’s capital plan.