


Stop Dedicating Lanes to Buses
Cars make better use of them.

City after city has granted its city-bus company exclusive access to lanes that cars could previously use.1 Press coverage of the resultant dedicated lanes has described benefits and drawbacks. But it hasn’t given the reader much basis for determining whether dedicated lanes are a net benefit to the citizenry as a whole.
Taking Indianapolis as an example, we’ll attempt that determination here. We’ll find that dedicated lanes are more likely to reduce a city’s overall mobility than increase it.
The IndyGo Makeover
IndyGo, as the Indianapolis’s bus company is known, began early in the last decade to promise that it would make itself over in return for about a $55 million increase in its annual subsidy. IndyGo said the increase would enable it to expand service by 70%. Hours of operation would be extended, but the added service would principally take the form of increased bus frequency. Low frequency had been blamed for IndyGo’s low ridership, and proponents seemed to imply that the makeover would cause ridership to skyrocket. Voters accordingly approved the subsidy increase in a 2016 referendum.
Although residents have been paying the increased subsidy for over three years now, most of the promised service increase has yet to be realized. IndyGo has instead focused the added revenue on building the makeover’s centerpiece: three so-called bus-rapid-transit (“BRT”) routes. The Red, Purple, and Blue Lines, as they will be called, are supposed to provide nearly as much speed and reliability as trains but with the greater flexibility and lower cost of ordinary buses.
Bus Rapid Transit
To convert a normal route into a BRT line IndyGo excludes cars from most of the street lanes that the route’s buses use. So its BRT buses are like trains in that car traffic doesn’t delay them much. Often adding to the train comparison is transit signal priority: turning stop lights green when BRT buses approach. And BRTs’ speed may be enhanced further by making their stop spacing greater than conventional routes’.
Then there’s fare collection. In normal city buses fare collection slows boarding because passengers have to pay or show a pass as they board the bus. Boarding is faster on, say, subways because passengers have already paid; they’ve had to in order to enter the station. BRTs, too, tend to use pre-payment to expedite boarding, but in most cases passengers don’t have to pay to enter the “station” (usually just a more-elaborate bus stop). Instead, payment is enforced by fining passengers who’ve been found by random checks to lack proof of payment.
Not Very Rapid
So far these measures haven’t resulted in much speed on IndyGo’s one BRT Line that’s already operating. Federal Transit Administration (“FTA”) records through October 2020 indicate that Red Line buses took 75,092 hours to travel 1,013,908 miles, for an average speed of 13.5 miles per hour. That’s only negligibly faster than the 13.3 miles per hour that FTA records imply for IndyGo’s other buses.
According to FTA records for 2019 the Red Line’s 704,665 trips provided 2,550,235 passenger miles of transportation: the average Red Line ride was only 3.6 miles long. So the minuscule speed difference has saved the average Red Line rider only 15 seconds (although that quantity’s monthly value has varied widely, exhibiting a standard deviation of over a minute). And we don’t know how much of that savings is attributable to dedicated lanes as opposed to other measures, like greater stop spacing and fare pre-payment, that don’t require dedicated lanes to implement.
Even such savings as there are can be misleading; dedicating lanes has made the Red Line less direct than it might have been. The trip from the Downtown Transit Center to 38th & College, for example, takes nineteen minutes on the Red Line but only fifteen minutes on ordinary, mixed-traffic Route 4.
Also, ridership has been disappointing. Before the referendum, IndyGo claimed that the Red Line would average 11,000 passengers per day. That hasn’t happened, and there’s little evidence that it ever will. True, the Red Line attracted about 8,000 per day in its first month. But that was when rides were free and the city was awash in Red Line publicity. According to the FTA, no month since the Red Line started charging fares has averaged more than 4,000. And some of the the Red Line’s current ridership will probably be cannibalized by the Purple Line when it begins operation.
So the Red Line probably won’t ever average 11,000 daily riders. But we’ll base some back-of-the-envelope calculations on that prediction anyway. Specifically, we’ll assume 5,500 daily riders in each direction. Spread over the Red Line’s 20 hours per day, that’s an average of 275 riders per hour. Let’s say that during the evening rush hour the volume in the predominant direction is twice that, or 550 passengers per hour. Then an hour’s worth of predominant-direction rush-hour passengers would together save a total of only 2.3 person-hours.
In due course we will demonstrate why loss of those lanes cost motorists several times that many person-hours. For now, though, consider that a 2013 count of a day’s traffic at a spot on College Avenue near 38th Street was 17743, or about 22,000 car passengers if car occupancy is about 1.25. Counts at some Red Line locations were more than this and some were less, but they all exceeded the 3,000 average bus passengers that our inflated 11,000 daily passengers would imply. (According to FTA records for 2019 the Red Line's 704,665 trips provided 2,550,235 passenger miles of transportation for an average trip length of 3.6 miles out of the Red Line’s 13.1-mile length; 11,000 × 3.6 ÷ 13.1 ≈ 3,000.) While this calculation is admittedly simplistic, it suggests dedicated lanes are a net time loss unless they save bus riders at least seven times what they cost motorists.
Experts’ Statements May Be Misleading
Here we digress to something illustrated by the Red Line’s ridership: that experts’ statements are often misleading and sometimes objectively false. Perhaps because experts tend to deal with specialized information, this happens surprisingly often even when the experts are making sincere attempts to convey the facts clearly. And in public-policy contexts they often seem not to be.
Take IndyGo’s April 30, 2020, notice stating that “The IndyGo Red Line . . . provides . . . service to an average of 7,000 trips per day through the heart of Indianapolis.” This statement came straight from the organization best positioned to know the facts, and ridership seems to be a quantity that’s not open to much interpretation; 7,000 rides is 7,000 rides. IndyGo personnel are the experts and we aren’t, so the common inclination would have been simply to accept that the Red Line’s daily ridership averaged 7,000.
But that would have been a mistake. IndyGo’s most recent report to its board of directors had instead given the Red Line’s average for that year as 3,779. (For the Red Line’s inaugural four months in 2019 it had reported 6,257, but for that year’s sole month in which fares were actually collected it preliminarily reported a value of 4,194, which was reduced to 3,930 for the FTA report.)
IndyGo clearly intended to give the impression that the Red Line’s daily ridership averaged 7,000. But its awkward language (“provides . . . service to 7,000 trips per day” instead of “provides 7,000 trips per day”) seems to have been designed to give IndyGo an out in case the discrepancy ever got detected. Perhaps, for example, IndyGo would say that the 7,000 figure was meant additionally to include trips on routes that Red Line riders transfer to or from. Whatever that wording’s purpose was, it wasn’t to provide clarity.
Insist on Seeing the Evidence
Fortunately, we could check that fact out. But what about facts we can’t check?
Consider in this connection an argument IndyGo could make against the time-savings values we calculated above. It could say that our calculation tacitly assumed there’s no correlation between occupancy and speed. Suppose, for example, that the 13.1-mile Red Line includes a 3.6-mile stretch on which its buses average 14.1 miles per hour despite their 13.5-mph average over the route as a whole. If none of the 550 rush-hour riders per hour rode the bus anywhere but on that fast stretch, an hour’s worth of rush-hour bus riders would save 8.5 hours instead of the 2.3 hours we calculated above.
Now, we’ll see that this scenario’s 8.5 person-hours in savings still isn’t so great, and it’s not very realistic. (It would require the 50-seat Red Line buses’ occupancy on that stretch to average about 92 passengers per bus.) But it does demonstrate that without knowing the Red Line’s speed and ridership as functions of location we can’t really be sure how much time the average rider saves.
If we have indeed underestimated the time savings, however, then the evidence of higher time savings is in IndyGo’s possession. So we are entitled to draw an adverse inference if IndyGo claims we’ve underestimated but fails to provide the evidence. No credence should be accorded an expert who’s reluctant to provide proof.
Street-Lane Math
Let’s now turn to how losing those lanes affects motorists. This is one of those discussions of which we laymen are typically expected to butt out. Car traffic is complicated, and laymen don’t have enough information to determine those effects with any precision. That’s why we pay all that money for traffic studies and why consultants generate those long reports and impressive Power Point presentations. Laymen can’t do all that. But let’s take stock of what we can do instead of just throwing our hands up and accepting what dedicated-lane proponents tell us.
We’ll start with how much space buses occupy. On the routes to be replaced by BRTs, IndyGo’s conventional buses share lanes with cars and come every quarter or half hour. Let’s say that a bus plying those routes is 40 feet long and averages 13 miles per hour. That means the bus takes 2 seconds to pass a given point on the route. Adding a 2-second separation from the car in front of it means the bus occupies only 4 seconds of every quarter or half hour: it leaves cars over 99% of the lane capacity.
IndyGo’s BRTs, on the other hand, don’t share their lanes with cars. By and large they’re slated to come once every 10 minutes. But here let’s say they come every 5 minutes, because there will be a forty-block stretch that’s shared by two BRT lines, and there’s already a thirty-block stretch where a single BRT line’s north- and south-bound buses share the same lane. IndyGo’s BRT buses are 60 feet long, so they take 3 seconds to pass if their speed averages 14 miles per hour. That means they occupy only 5 seconds out of every 5 minutes, wasting over 98% of the lane’s capacity by excluding cars.
Now let’s do cars. Assume that the average car’s length is about 17 feet. (An F-150 pickup’s length is about 19 feet, whereas a Honda Civc’s is about 15.) Then our 2-second-separation assumption implies that maximum vehicle speed is the following function of vehicle density:
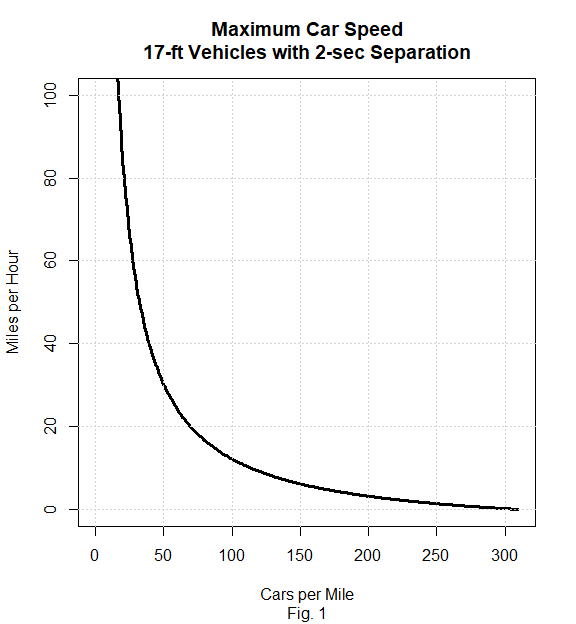
Crowding cars from two 60-vehicle-per-mile lanes into a single 120-vehicle-per-mile lane, for example, reduces the cars’ speed from 24 to 9 miles per hour. Usually, of course, minimum spacing isn’t the only factor that limits car speeds, so the speed reduction wouldn’t always be so drastic. And congestion can cause some motorists to abandon the now-slow street in favor of streets that previously had been the slower ones. Initially, though, we’ll take this speed difference as an example and observe its effect.
Mobility
For this purpose we’ll step back and consider one of a city’s most important features: its function as a job market. A great many companies that bid for our services as employees are located in cities. In this respect cities become more attractive as their densities increase. So perhaps it’s understandable that urban planners seem to have a density fetish.
But density’s benefits are not unalloyed; density can impose costs in both time and money. Also, many people prefer not to live cheek by jowl with their neighbors. So a city’s density, including its job density, tends to strike a balance among those and other factors.
Job density doesn’t tell us much by itself, though; all the jobs in the world wouldn’t do us much good if we couldn’t reach them. So we’ll consider the definition that urban economist Alain Bertaud gives to mobility: the number of jobs the average resident can reach from his home within, say, forty-five minutes.
Measuring mobility with complete accuracy would require knowing not only where every job is but also each resident’s available transportation modes; not everyone has access to a car. In general, though, average traffic speed is an important determinant. Fig. 2 illustrates this conceptually.
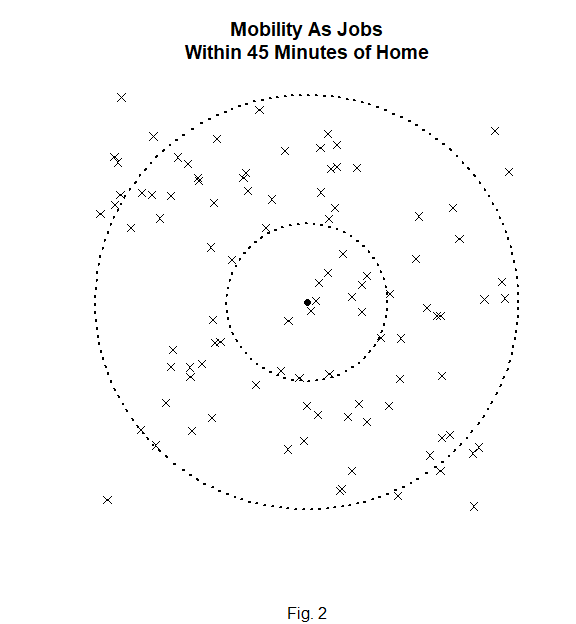
The dot in the center represents a resident’s home, the x’s represent job locations, and the inner and outer dashed circles represent 45-minute ranges at respective speeds of 9 and 24 miles per hour. Most of the depicted jobs are reachable in forty-five minutes if the resident can average 24 miles per hour. If lane loss reduces the average to 9 miles per hour, on the other hand, the resident can reach less than 15% of them. That diagram is highly simplistic, of course, because average speed isn’t isotropic and jobs tend to be more clustered. But it demonstrates how mobility can have a square-law relationship to average speed.
Incidentally, cars have mobility advantages over buses, and those advantages aren’t limited to relative speed. Consider a teacher whose 6.8-mile commute from her home at 21st & Emerson to her job at Riverside High School takes 18 minutes by car. If for some reason her car’s average speed were instead restricted to only 13 mph, i.e., to about a typical city bus’s average, her commuting time would increase to 31 minutes. But going by car would still take only half as long as going by bus; car routes tend to be more direct. (And we haven’t mentioned that after work the car will enable her to be on time for her son’s game at Little Flower School and to pick up a pizza on the way home.)
Again, losing two lanes out of four will not in practice crowd all cars onto the same street’s remaining lanes. But not only will a car that doesn’t remain be resorting to a sub-optimal route but it will also be increasing that route’s congestion: it’s likely to propagate its efficiency loss to multiple cars on other streets. Dedicating lanes to buses therefore degrades motorists’ mobility.
Modeling Traffic
We’ll approximate motorists’ resultant loss of time by using a rudimentary traffic model, one that simulates traffic flow in a single lane about a one-mile loop. To explain the model’s output we’ll first run it without traffic lights or speed limits: just 25 cars on the one-mile loop.
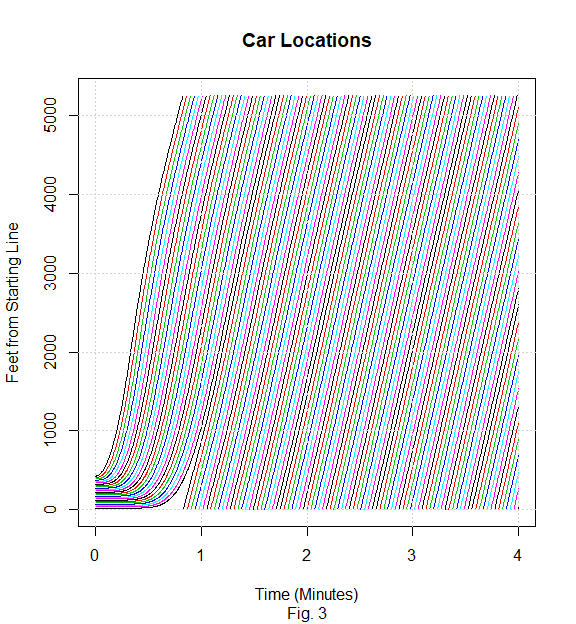
Each curve in Fig. 3 represents a car’s path. Fig. 3’s lower left represents all cars’ starting out stationary and bunched together. The leftmost curve represents the first car’s trajectory. It slants upward to represent proceeding along the loop. When the first car reaches the 5280-foot point, it has returned to the finish line, so the curve discontinues at the top and resumes at the bottom. The other curves show that the remaining 24 cars begin more slowly; they have to wait until space has opened up in front of them.
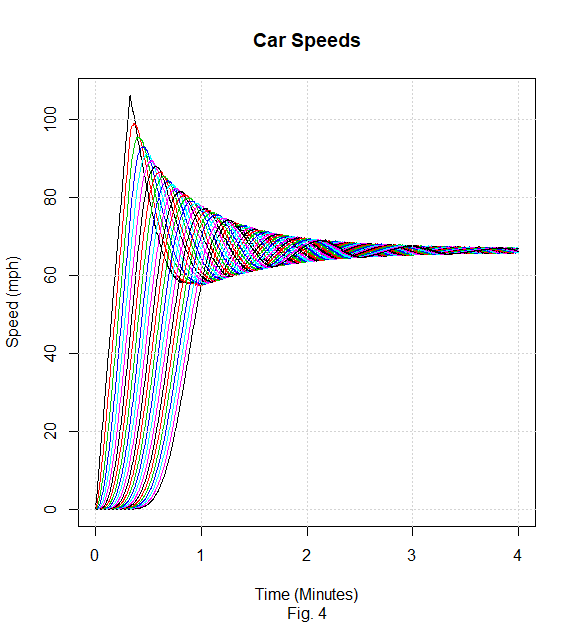
Fig. 4 depicts car speeds as functions of time. It shows that the first car initially accelerates to a high speed but then has to slow down as it approaches the last car. In this simulation the cars’ speeds are limited only by the required spacing, so Fig. 4 merely tells us what Fig. 1 already had: a 25-car-per-mile density would cause the cars to settle on the 66-mph speed that Fig. 4 illustrates.
Rush Hour and Stop Lights
Now we’ll impose a 30-mile-per-hour speed limit and simulate rush hour by adding more cars and some stop lights. As a very rough stab at simulating random effects such as slowing for cars that enter from side streets, we’ll also include randomly located temporary obstacles. And this time we’ll start with the cars spaced evenly around the entire loop.
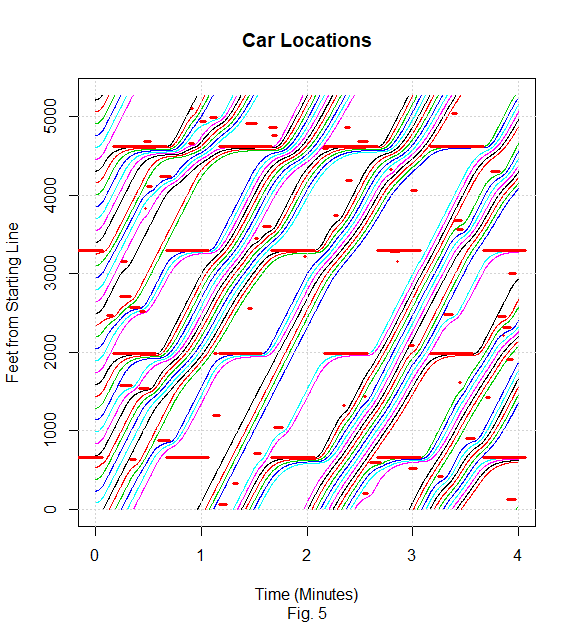
The horizontal red lines represent the locations and times of red lights and other obstacles. If we had used fewer cars and miscellaneous obstacles the cars would have averaged closer to the 30-mile-per-hour speed for which the lights are timed. With the obstacles and 35 cars, however, congestion limits the average speed to 20 miles per hour. On average the car frequency turns out to be 694 cars per hour.
Appropriated Lane
Suppose that the lane we’ve just simulated is one of a four-lane street’s two outer lanes. Right-hand lanes sometimes conduct more cars than left-hand lanes do, although the reverse is also true, and the effect is somewhat diminished at rush hour. So let’s say the same-direction left lane’s volume is only 70% of the right lane’s, making the total volume in that direction 1180 cars per hour (if we ignore the fact that the left lane’s average speed would probably differ from the right lane’s). Now we’ll assume that IndyGo appropriates one of those lanes and that as a result 20% of the cars find alternate routes. To simulate the remaining cars’ squeezing into the remaining lane we’ll re-run the simulation with 48 cars:

That reduces the average speed to 16 miles per hour.
While the average Red Line rider saves only 15 seconds in a Red Line-average 3.6-mile trip, each motorist in the scenario above suffers a 2.4-minute addition to the time required for a trip of that same length. So the remaining 80% of the 1180 vehicles that could have passed a given location in an hour if both lanes had been available would collectively lose 37 hours, or 46 person-hours if average car occupancy is 1.25.
Again, the average length of a Red Line trip is only 3.6 miles, whereas the Red Line as a whole is 13.1 miles long. This means that the 2.3-person-hour value we calculated above for aggregate bus-rider time savings over the route as a whole translates to 0.6 person-hours saved by the average number of rush-hour passengers who pass a given route location. According to our model, that is, motorists would lose 72 times as many person-hours as bus riders gain.
Of course, the model provides only a rough estimate. So suppose that riders actually gain two minutes each instead of only 15 seconds and that each motorist loses only half as much time as our model found. Motorists would still lose nine times as many person-hours as riders gain. Note also that this calculation attributes all the Red line time savings to dedicated lanes, ignores losses from route indirectness, and assumes IndyGo’s inflated 11,000-riders-per-day prediction, which is probably double the volume that will eventuate.
Furthermore, it doesn’t take into account the congestion caused on other streets by the cars that leave the simulated street in response to lane loss. And remember that cars’ speed differences affect mobility more than buses’ do. So it’s hard to escape the conclusion that IndyGo’s dedicated lanes impair Indianapolis mobility.
Models Are Based on Guesses
In evaluating that analysis it’s important to keep in mind how much it’s based on guesses. We guessed, for example, at how many cars lane appropriation would cause to leave the street. We implicitly assumed that any correlation between the buses’ average occupancy and their speed as functions of route location would be insignificant. We guessed that the rush-hour multiplier for buses would be roughly the same as it is for cars. And the average inter-car interval we assumed could no doubt be refined.
Beyond that, our choice of values for quantities such as the numbers of cars and obstacles, the stop-light timing and spacing, and the cars’ rates of acceleration and deceleration wasn’t based on anything like first principles. Instead, we tried different combinations until the Fig. 5 simulation produced a typical rush-hour traffic volume. So the time loss we inferred from the speed difference between the simulations of Figs. 5 and 6 depended not only on the number of left-lane cars we assumed but also on many of those rather randomly chosen parameter values.
But Models Trump Real-World Data
Our model’s output could therefore be looked upon as computer-laundered guesses. But it’s not clear how much this distinguishes our model from lots of others, including those on which experts base policy recommendations. And a report that IndyGo’s traffic expert based on “VISSIM microsimulation modeling” casts doubt on how often users take such models’ limitations into account.
Directed to the then-upcoming Red Line construction, that report predicted:
“Most beneficial to the BRT operation, all of the Build Conditions concept designs analyzed in VISSIM will improve the bus travel speeds compared to existing bus speeds. As shown in Table 4-5, bus speed will increase between 9 and 200 percent. These speed increases will be critical to the success of the BRT system in providing fast, efficient and reliable service.”
It’s not apparent that anyone at IndyGo or the Indianapolis City-County Council, which imposed a tax to support the Red Line, seriously considered the report’s evidence for that statement. If they had, they would have seen that it was based on model outputs such as those found in the report’s Table B-27. According to that table the BRT conversion would reduce the Capitol Avenue stretch’s southbound morning travel time from 1028.8 seconds to 375 seconds, i.e., by almost 11 minutes.
But why did traffic experts use model output as their value for ordinary-bus travel time? Why not use real-world data? At the time the report was prepared Route 18 buses were traveling that stretch many times a day. If the experts had timed some of those buses they would have found the travel time to be only 7 minutes rather than the model-output value of over (1028.8 sec. ÷ 60 sec./min. ≈ ) 17 minutes. And that wasn’t the only instance in which they exalted favorable model output over real-world data.
Now, that report didn’t deal with bus ridership. But at the time of the report IndyGo’s Web site had said, “Based on current demand and travel modeling, initial, conservative estimates show approximately 11,000 trips per day will be made via the Red Line.” Combining that prediction with real-world bus-travel-time data and the traffic report’s car-traffic delays and volumes would have shown that the Red Line would likely cost much more time than it would save—even though that 11,000 figure was exceedingly optimistic.
The Purple Line
An August 2020 IndyGo presentation suggests that the Purple Line, too, will cost residents time. That presentation’s eleventh page said that on the section of 38th Street between Post Road and Emerson Avenue the current Route 39’s metamorphosis into the Purple Line will save bus riders four minutes and cost motorists three-and-a-half.
Let’s do the math. Before IndyGo’s prediction of 11,000 daily Red Line riders proved false, IndyGo had also been predicting (a more plausible) 4,500 daily riders for the Purple Line. Projecting from this value in the same way we did from the Red Line’s 11,000 yields an evening-rush-hour peak of only 225 passengers per hour in the predominant direction. That’s for the 15.2-mile route as a whole. Let’s say the Purple Line’s average trip length turns out to be, say, 6.0 miles instead of the Red Line’s 3.6. That implies about 89 passengers per hour at an average location.
So an hour’s worth of rush-hour riders would save only 5.9 person-hours on the Emerson-to-Post Road stretch even if IndyGo’s time-savings prediction proves true. But Indiana Department of Transportation data suggest that an average location on that stretch currently sees more than 800 predominant-direction rush-hour motorists per hour. That means that motorists’ loss on that stretch would exceed 47 person-hours even if 20% percent of current motorists sought other routes: motorists would lose at least 8 times as many person-hours as bus riders would gain. And, again, this doesn’t take into account that congestion will increase on those other routes or that cars provide more mobility than buses do.
Stay Skeptical
The public’s knowledge of IndyGo operations is far from adequate; what little information IndyGo does provide tends to be misleading. But what we do know strongly suggests that dedicating lanes to city buses impairs Indianapolis mobility. And logic tells us that appropriating busy-street lanes will likely reduce mobility in any city whose bus ridership is similar.
Bus-company subsidies pay not only for bus service but also for pro-subsidy propaganda. Particularly in this era of cratering press professionalism we need to be skeptical of the benefits commonly claimed for transit.
A previous version of this post gave federal funding as a motivation for dedicated lanes, but further investigation has failed to support that assertion..
Their statements are not misleading. They are just lying. Liars lie. Bullsh.tters bulls.t. It is the same with everything they do - whether stadiums, TIFs, tax abatement, etc. I once asked an economics professor who wrote op-eds for the Star occasionally what he would have told a student if they had turned in that nonsensical study provided by an "expert" accounting firm to support Lucas Oil Stadium boondoggle. He replied, as I suspected, that he would have handed it back and told him to start over. Yet people touted that "study" as if it contained some profound knowledge. It was absurdly laughable. But the "expert" study was provided - Check and checkmate.