


What IndyGo Should Tell the Public
For example, that its rides cost more in subsidies than they're worth to riders.
Introduction
Our previous post reported that the Indianapolis Public Transportation Corporation (“IndyGo”) was invited to attend the Indianapolis City-County Council Municipal Corporations Committee’s April 5, 2023, meeting in order to provide the public more information than had been forthcoming at the Committee’s March meeting.
The backdrop of that invitation was a November 2016 referendum in which Indianapolis residents had approved a 0.25% transit income tax. IndyGo had promised that with the proceeds it would so increase bus hours and frequency as to raise the average number of buses on the streets by 70%. Part of that increase was to come from three so-called bus-rapid-transit (“BRT”) lines, which would have more-elaborate bus stops and by using dedicated lanes would whisk passengers more quickly and reliably to their destinations.
Residents have been paying that tax for five years now, and at the March meeting councilors attempted with indifferent success to elicit information about how well IndyGo had fulfilled its promise. This post and two that will follow present questions to which non-evasive answers in the April meeting would help provide the “deeper dive” for which Councilor Brian Mowery expressed a desire.
The Questions
What Percentage of Indianapolis Residents Ride IndyGo?
IndyGo still hasn’t reported the results of its most-recent on-board survey, so this question may be hard to answer. But we’d guess that less than 2% of Indianapolis residents take the bus even once a year and that only half that many take it to work every day.
That guess is based on ridership statistics and the previous survey, from which a 2017 study by IUPUI’s Polis Center reportedly inferred that only 26,000 residents took the bus and that only half of those took it to work every day. At the time of the study IndyGo’s annual ridership was 9.2 million. Based on the fact that ridership has fallen since then to about 5.5 million our guess is that now only about 15,500 residents, amounting to only 1.6% of Marion County’s population, still ride the bus.
So the claim that “transit is essential” in Indianapolis seems increasingly divorced from reality. To those who wonder “how we would make this city run” without IndyGo the answer is that something like 98% of Indianapolis residents would make it run in the same way they do now—but, with more street lanes open to motorists, maybe a little faster.
What Percentage of Low-Income Residents Ride IndyGo?
The answer is probably less than 8%.
IndyGo’s Transit Is Essential Pocket Guide (“the pocket guide”) observes that 71% of IndyGo riders live in households whose incomes are less than $35,000. Note that $35,000, although not princely, significantly exceeds the poverty level for the average-sized household. It’s also about $4,000 more than the $30,931 given by Table 2.4 of Gramm et al. as the average for the second earned-income quintile, and it’s far more than the lowest quintile’s $4908 average. So the portion of IndyGo riders in actual poverty is less than 71%, and we can infer from the 15.1% local poverty rate that probably less than (0.71 × 0.016 ÷ 0.151 ≈) 8% of local residents who fall below the poverty line are bus riders.
More important, that $35,000 figure no doubt refers to earned income. According to Gramm et al. the average amounts that households actually have to spend after transfer payments and taxes are taken into account are $49,613 for the lowest earned-income quintile and $53,924 for the second. Those averages are only about $16,000 and $12,000, respectively, less than the $65,631 the average middle-quintile household can spend. And even those differences result largely from the fact that bottom-quintile households tend to be smaller. Adjusting for household size shrinks the difference to less than $3,000 per capita; indeed, the bottom quintile has more to spend on a per capita basis than the second or middle quintile does.
What this means is that a significant portion of the populace would have more to spend if they didn’t work. So the need for a further income-transfer mechanism isn’t a very compelling argument for subsidizing IndyGo.
How Much Has IndyGo “Service” Increased Since the Referendum Year?
Actually, this is more of a why-not question than a how-much question.
To IndyGo service means buses on the streets, not passengers in the seats. But even by that measure IndyGo has fallen far short of its 70% pre-referendum promise. The 581,960 fixed-route revenue hours IndyGo logged in 2022 amount to only 12% more than the 518,142 it logged in the referendum year, 2016.
Part of the reason for this shortfall is that IndyGo has been slow to build the three promised BRT routes, which were all supposed to have been finished by now. Although the first BRT route, known as the Red Line, has been running for three and a half years, the promised Purple and Blue Lines have yet to provide a single ride.
But that doesn’t account for all of the shortfall. Before the referendum IndyGo told residents that non-BRT routes would provide most of the service increase, through hours extensions and frequency increases. Nothing about such changes would require waiting for the Purple and Blue Lines to commence operations, because the routes taken by those lines won’t differ much from existing Routes 39 and 8—whose buses already run every fifteen minutes. Simply changing where conventional buses travel or how frequently they run doesn’t require fancy new stations or street reconfigurations. All it requires is more buses and drivers.
Here are a couple of IndyGo’s recent excuses for the shortfall:
Like other transit agencies, the COVID-19 pandemic has significantly impacted IndyGo’s ability to retain and attract bus operators and bus riders.
The sudden decrease in ridership in 2020 continues to have a direct impact on the agency’s ability to move forward with the implementation of the network redesign. It has made it harder to project how much revenue the agency will have in the next three, four or five years, which is a key factor in determining how fast IndyGo can implement the remaining local route improvements.
That second excuse doesn’t ring true; fare revenue has fallen only about $4 million since the last pre-pandemic year, and IndyGo has received many times that much in stimulus funds. Even if it hadn’t, moreover, IndyGo’s subsidy is well north of $100 million, and a revenue decrease of less than 4% can’t explain a 34% (= (170% - 112%) ÷ 170%) service shortfall.
If the problem is that IndyGo can’t hire drivers, on the other hand, then IndyGo has saved money by not paying the drivers it didn’t hire and not buying fuel for the buses they’re not driving. So why not reduce or eliminate the transit tax until IndyGo can find the drivers to provide the service that residents are paying for but not getting? The money thereby left in taxpayers’ pockets could then be spent on attic insulation, hearing-aid batteries, and other things they need instead of on cutesy videos and propaganda.
What Is IndyGo’s Overall Cost per Ride?
IndyGo’s nominal fare is $1.75, but that would be just the tip of the iceberg even if the actual fare average weren’t closer to a dollar. On page 26 of the pocket guide IndyGo lists its 2023 budget total as $263.1 million, of which operating expenditures account for $129.8 million. If IndyGo’s overall ridership in 2023 exceeds its 2022 value of 5.6 million by 5%, that comes to $22 in operating expenditures and $45 in total budget per ride.
To put that in perspective, consider that if we include the typically longer rides on IndyGo’s door-to-door van system IndyGo’s average ride length in 2021 was 4.7 miles. In an Indianapolis cab a trip of that length would cost a little over $14 with tip. If, say, 70%, 22%, 6%, and 2% of cab trips respectively carry one, two, three, and four passengers, that amounts to just over $10 per person. So IndyGo costs something like two to four times what cabs do: bus rides’ overall cost exceeds their value to the riders themselves.
And those IndyGo costs per ride translate to about $4.50 or $9.50 per passenger-mile, which is well over ten times the $0.34 per passenger-mile cost of a $62, 183-mile bus trip to Chicago. IndyGo also costs over ten times most people’s average car expenditure per passenger-mile, even when insurance, maintenance, and road subsidies are taken into account.
Why the Special Property-Tax Levy?
Note that $14.8 million of the $38.8 million that IndyGo lists as “Local Property and Excise Taxes” will be obtained through a special property-tax levy to which the statute says the bus company can resort only when “it is anticipated that the total amount available to a public transportation corporation will be insufficient to defray the expenses incurred by the corporation.” IndyGo started exploiting this tactic a few years before the transit income tax was approved. Although IndyGo now receives a dedicated income-tax stream, has banked federal stimulus funds that far exceed its fare-revenue decrease, and doesn’t bear the expense of the promised-but-undelivered expansion, it continues to contend that the “amount available” to it would be “insufficient to defray the expenses” it will incur.
That contention could use some explaining.
What Is the Local Subsidy Burden?
The pocket guide also lists IndyGo’s take from the transit income tax as only $45.7 million even though IndyGo actually expects this tax to drain $64.1 million1 from residents' pockets. The justification for the lower figure appears to be that IndyGo earmarks the remainder of its income-tax take for capital expenditures or debt service.
Although there can be sound reasons for thus separating receipts, doing so in this context is misleading; it invites the public to believe the transit income tax’s burden is less than it really is. For all we know, moreover, the property-tax burden is similarly understated. We can’t say for sure, because IndyGo doesn’t make that information easy to ferret out. But we can say that, instead of the ($38.8 million + $45.7 million =) $84.5 million given by the pocket guide as the local burden for 2023, Table 2 of the latest available IndyGo financial report says it was $111 million in 2021, and the 2023 value is unlikely to be much lower than that.
Moreover, we have reason to believe that even this $111 million figure understates the 2021 burden. IndyGo’s accountants name line items somewhat whimsically, and we suspect that most of the $9.9 million its financial report calls “Municipalities” actually came from Indiana’s apparently sales-tax-funded Public Mass Transportation Fund (PMTF”). If so, that money, too, was taken from residents’ pockets. Now, IndyGo’s PMTF share is disproportionate to the Indianapolis population and therefore presumably to its residents’ share of sales-tax payments, so we’ll estimate that the $9.9 million in state funds imposed only about a $6.4 million burden on residents. That still raises the local burden to $117 million.
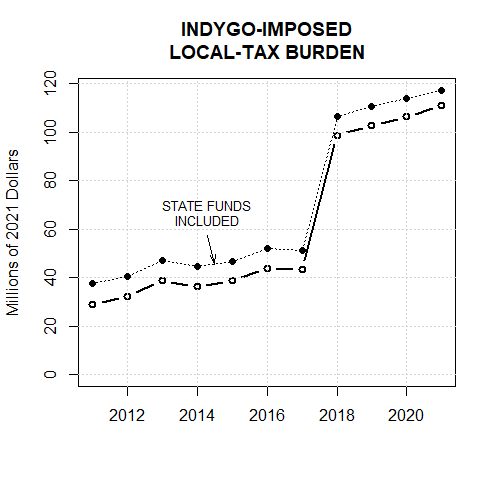
The plot above shows that similar calculations for previous years reveal more than a doubling of the local burden in 2018, the year in which IndyGo started collecting the transit income tax. It also shows that the subsidy in 2021 was over three times what it had been ten years before, when IndyGo managed to provide over 60% more rides. And the plot below indicates that the burden has become even worse on a per-ride basis.

That plot tells us that for what it cost a resident who never rode the bus in 2021 to subsidize a stranger’s single ride he could probably have filled his daughter’s lunchbox for the better part of two weeks—or taken two cab rides. True, the burden has probably lessened a little since 2021 on a per-ride basis as ridership has increased modestly. Unless the Council reduces IndyGo’s subsidy and it responds with some right-sizing, however, the subsidy per ride will probably continue to exceed even what cabs cost.
We haven’t mentioned the federal subsidy, because the political class seems to look upon it as federal largesse. But we shouldn’t lose sight of the fact that in most years the federal subsidy comes mainly from gasoline taxes. Indeed, federal gas tax provides transit systems more subsidy per transit passenger-mile than motorists get in road construction and maintenance per car or truck passenger-mile.
What Fraction of IndyGo’s Fixed-Route System Do Fares Cover?
The 2023 budget suggests that the answer is 4.5%, yet IndyGo claims to have complied with the statutory requirement that its fare revenue cover “at least twenty-five percent (25%) of the operating expenses of the urban mass transportation system operated by the public transportation corporation.”
To show that in fact IndyGo has not complied we first need to recognize that the 25% requirement doesn’t apply to the door-to-door van system IndyGo provides for qualified residents. The van system’s routes vary in accordance with passengers’ directions, so the statute expresses the van-system exception by referring to IndyGo’s regular-bus system as its “fixed route services”: “For purposes of this subsection, operating expenses include only those expenses incurred in the operation of fixed route services that are established or expanded as a result of a public transportation project authorized and funded under IC 8-25.”
We therefore subtract from the 2013 budget’s $129,758,882 in total operating expenses the $13,113,967 it allocated to the van system, leaving $116,644,915 subject to the 25%-fare-recovery requirement. Since the 2023 budget envisions only $5,190,830 in passenger fares—and not even all of that comes from the regular, fixed-route system—IndyGo’s budget implies that fares will cover less than ($5,190,830 ÷ $116,644,915 ≈) 4.5% of the fixed-route services’ operating expenses.
The rationale for IndyGo’s contention that it has nonetheless met the statutory requirement seems to have evolved. At one point IndyGo seemed to seize upon the statute’s van-exception language to contend that the 25% requirement applied only to the BRTs. But on the question of what the system is that was to be “established or expanded” with transit-tax funds IndyGo’s budget book makes the following admission:
The public question that appeared on the ballot described the purpose of the income tax increase, up to 0.25%, dedicated for these transit improvements:
· Create a connected network of buses and rapid transit lines.
· Increase service frequency.
· Extend operation hours.
· Implement three new rapid transit lines.
Although the fourth bullet point focuses on the BRT lines (“three new rapid transit lines”) the other three are not so restricted. And, even if they were, FTA data say that for the BRT line alone fare recovery was less than 9% in 2021, the last year for which such a breakdown is available.
Anyway, IndyGo’s theory now seems to be that the 25% requirement’s denominator should be the cost not of the entire system “established or expanded” but only of the expansion increment. Specifically, it contends that the cost increment left after it “reduced service due to COVID” in 2021 was only $17,246,202, of which the $5,190,832 it collected in fares was 30%.
But a little reflection reveals that such a statutory interpretation could find IndyGo in compliance even if charged no fares at all. All IndyGo would have to do is reduce service to the referendum-year level, thereby making the service increment and its corresponding expense increment zero. In accordance with IndyGo’s interpretation, in other words, the 25% requirement would permit IndyGo to extract 0.25% of residents’ income—projected to total $64.1million this year—forever without providing any of the service increase it promised referendum voters they’d get by approving the tax.
Apparently this is what IndyGo—and perhaps the majority of the City-County Council—want residents to believe the Indiana General Assembly meant by its requirement that riders bear at least 25% of the burden.
Exactly What “Sources Other than Taxes and Fares” Add Up to $12.14 Million?
The employers who lobbied the Indiana General Assembly for an increased IndyGo subsidy opposed funding it through a corporate tax. People like Mark Fisher, then an IndyGo board member and Indy Chamber’s vice-president of government relations, reportedly thought employers would instead support it voluntarily. The statute accordingly requires IndyGo to establish a foundation for receiving such voluntary support and that “at least ten percent (10%) of the annual operating expenses of the public transportation project must be paid from sources other than taxes and fares.”
In addition to applying the same tortured reasoning to this 10% requirement as it does to the 25% requirement, IndyGo claims that it “brought in about $12.14 million from sources other than taxes and fares in 2021.” So far as we can tell, however, Table 2 of its 2021 financial report lists at most $888,230 from such sources: $711,593 from selling ads, $84,474 from investment income, and $92,163 listed as “other.”
Now, that report further says the foundation IndyGo set up to receive donations had revenues of $448,038 “with approximately $227,568 of revenue and expense related to IPTC that was eliminated when blended into the financial statements.” That “blended” language makes us suspect that adding the foundation revenue to the Table 2 quantity would involve some double-counting, but the $1,336,268 we’d get by doing so still is much less than the claimed $12.14 million.
True, the report also lists larger quantities, with names like “Municipalities,” “Federal assistance,” and “Contributions – capital grants.” But those are probably state sales, federal gasoline, and other taxes. We know, for example, that IndyGo frequently uses the term grants for federal gasoline taxes that IndyGo has been able to obtain through rent-seeking activity.
In short, IndyGo should explain in detail how it concluded that $12.14 million of its “Nonoperating Revenues” came from “sources other than taxes and fares.”
Conclusion
IndyGo’s pocket guide says that transit is essential in Indianapolis, but it omits most of the context that would enable taxpayers to make an informed decision about that. Candid answers in the upcoming meeting to questions like those above would be a step toward providing some of the missing context.
The next two posts will provide questions for eliciting further omitted context. Whereas the foregoing questions dealt with IndyGo generally, subsequent posts’ questions, like whether “bus rapid transit” is really rapid, will be more BRT-specific.
See page 28 of its budget book.
Sounds like the third world or is that unfair on the third world.
Well analysed though and if the analysis was repeated in any city in the first world they might not compare so well to the third world.
However the blockers must have political support. Otherwise they would be fired. Perhaps you can comment on this last paragraph.