


Sen. Braun, You Need to Read This Book (Part II)
Climate-Science Uncertainty Is Far Greater Than You Think
Having seen in the last post how scientists whose jobs depend on the climate scare can misrepresent the past, we turn in this one to their speculations about the future. Again we’ll focus mostly on sea level.
National Geographic’s September 2013 cover illustrates the impression the press has managed to create in the public’s mind: a half-submerged Statue of Liberty. Climate scientists may deny having predicted such an extreme result. But they don’t go out of their way to point out as Dr. Koonin does that at the foot-per-century rate exhibited by the sea-level rise near Lady Liberty it would take over twenty thousand years to reach the depicted depth. (He also observes that the oldest surviving human structure is less than six thousand years old.)
The nearer-term predictions that career climate scientists do make vary widely, but AR5 Working Group I’s Fig. 13.11 summarized model projections of sea-level rise over the remainder of the century as follows:

The designations RCP2.6, RCP4.5, RCP6.0, and RCP8.5 indicate that those projections are based on the temperature changes that computer models say respective Representative Concentration Pathways (“RCPs”) of greenhouse-gas growth would cause. Just by itself the fact that these projections are based on climate models’ temperature predictions should give us pause. Climate models’ poor predictive ability can be seen in Alabama state climatologist John R. Christy’s March 2017 Congressional comparison of model outputs with actual mid-troposphere-temperature observations:

Obviously, model outputs are all over the place, and almost all of them wildly exceed actual observations—which suggest a modest and arguably beneficial trend. Yet the incentive structures created by government funding and newspaper circulation exalt such computer-laundered guesses over actual observations.
We’ll nonetheless consider the resultant sea-level projections for the four RCPs. RCP2.6’s assumption is that carbon-dioxide emissions will be reduced so drastically that the atmospheric greenhouse-gas concentration, currently equivalent to about 430 parts per million (“ppm”) of carbon dioxide, will peak at a carbon-dioxide equivalent of only 490 ppm and fall back to 460 ppm by 2100. RCP4.5, RCP6.0, and RCP8.5 are respectively based on year-2100 concentrations of 650, 850, and 1370 ppm.
Let’s place those numbers in perspective. The current emissions rate would raise the concentration to about 600 ppm by 2100, so RCP2.6 seems unrealistically low. RCP4.5 and RCP6.0 seem more plausible; the carbon-dioxide concentration would reach about 740 ppm if the world’s population increased in accordance with projections and its per-capita emissions increased linearly from their current level to half the current U.S. level by 2100. In contrast, RCP8.5 is widely recognized as far-fetched; its 1370-ppm value exceeds what the carbon-dioxide concentration would reach if the whole world started tomorrow to emit at the U.S.’s current per-capita rate.
For comparison purposes we’ll tack the Fig. 5 projections onto Fig. 2’s longest sequence:

Now, Fig. 7’s extensions only approximate the values that Fig. 5 drew from AR5’s Fig. 13.11. Based on that report’s Table 13.5 and page 1180, though, they’re close enough to show that the IPCC has projected more than a foot of sea-level rise by 2100 even under the RCP2.6 scenario, which would require that we so strangle our economies as to reduce emissions to pre-industrial levels.
The middle two scenarios, which could arguably result from allowing energy use to develop with little government intervention, would add less than five inches more to that purportedly unavoidable rise. So even taking Fig. 5’s uncertainty ranges into account we see that according to the IPCC the next eighty years’ proposed emissions-reduction efforts are unlikely to avoid much more sea-level rise than we’ve dealt with just fine, thank you, over the previous eighty years.

For further perspective Fig. 8 takes the Fig. 7 sequences’ 22-year trends and thereby tacks projections onto Fig. 4’s 22-year trends. This shows that for sea level to rise as much as the models predict the rate would have to be significantly higher than the last eighty years’ carbon-dioxide-concentration increase has caused.
Dr. Koonin’s detractors object that this doesn’t prove such an increase couldn’t happen. Well, of course it doesn’t. But the point is how little evidence there is for the impressions of disaster the climate establishment has created. Since Fig. 8’s projections are based on models that failed to predict the late-last-century slowdown, these facts are certainly relevant to how much weight we should accord such projections.
But suppose they do eventuate. Even removing as much carbon dioxide from the atmosphere as RCP2.6 requires would make only a modest difference in the sea-level rise we’d have to adapt to in any case. So particularly in light of how wrong past climate predictions have been we should be slow to base major resource re-allocations on predictions that as Dr. Koonin puts it “stem from implausibly extreme scenarios fed into models that, as we’ve seen, are clearly not up to the task.”
Arguably even worse than the climate models are economic models that use endlessly varied mathematical gymnastics to conjure up values for the so-called social cost of carbon. In his book Dr. Koonin focuses on a major constituent of that cost: “‘climate-related deaths,’ a menace based on speculation, strained assumptions, and incorrect use of data.”
He cites in particular the following apocalyptic vision that Michael Greenstone, director of the Energy Policy Institute at the University of Chicago, gave Congress:
. . . the increase in the global mortality rate due to climate change-induced temperature changes in 2100 is larger than the current mortality rate due to all infectious diseases . . . we estimate the full mortality risk due to climate change to be an additional 85 deaths per 100,000 in 2100.
That’s a truly eye-popping number. According to the International Disaster Database, it’s over 200 times the past decade’s average annual rate of death worldwide due to weather-related disasters such as heat waves, wildfires, floods, cyclones, etc.
We hasten to add that Dr. Greenstone may have arrived at that value by including deaths that might in some sense be considered temperature-related but don’t occur during a recognized disaster. But that’s hardly reassuring; conclusions that result from thus expanding the climate-related-death definition are bound to depend highly on assumptions. By expanding the definition, for example, a Lancet paper found mortality from cold to be about 17 times the mortality from heat, a result that Dr. Greenstone probably wouldn’t find congenial. And don’t forget Dr. Pierrehumbert’s demonstration of how climate science can misapply even the simplest of mathematical operations.
Anyway, that whopping rate of 85 deaths per 100,000 invited Dr. Koonin’s scrutiny. So he studied the paper that described how Dr. Greenstone and his colleagues used computers to infer a relationship between temperatures and deaths. He found it “fraught with assumptions and uncertainties.” In particular, the 85-per-100,000 value that Dr. Greenstone’s testimony claimed so confidently was actually just the mean of an 80%-probability range that extended all the way from 21 fewer deaths per 100,000 to 201 more.
For all the paper purported to infer, that is, failing to emit carbon dioxide could increase the death toll. Worse, it turns out that Dr. Greenstone’s testimony was based on the implausible RCP8.5 scenario. The range his paper obtained for the more-plausible RCP4.5 scenario extended instead from 45 fewer to 63 more deaths per 100,000. This isn’t the impression Dr. Greenstone left with Congress. And remember that the RCP4.5 estimate, too, was based on temperature projections from models that as Fig. 6 illustrates run very hot.
Now, a footnote to Dr. Greenstone’s written testimony contained a citation to the paper that Dr. Koonin consulted, so this is one of those instances where Dr. Koonin’s detractors can claim nothing had been hidden. But it seems unlikely that many legislators looked that paper up to see what it admitted: “Our full range of estimates reveals a remarkable degree of uncertainty.”
In example after example Dr. Koonin similarly demonstrates that those of us who are troubled by the way in which climate scientists downplay uncertainty aren’t just quibbling about minor details. Uncertainties lie right at the heart of the matter.
We’ll illustrate this by considering one possible policy proposal: a carbon tax. Ignoring how the political process would inevitably corrupt such a tax, we’ll imagine that a tax reaching, say, $150 per ton of carbon dioxide by early in the next decade could be collected with perfect efficiency and that with similar efficiency all the proceeds would be distributed to the entire population strictly on a per capita basis. We don’t know what the result would be, but we can assume it would fall between two extremes: (1) leaving fossil-fuel use entirely unchanged and (2) eliminating it completely.
We’ll ignore the first extreme, because it would have no climate effect: it would simply be another component of our massive (and significantly unseen) wealth transfer. (It wouldn’t be a very targeted component, either; some of the tax extracted from Jasper truck drivers who use a lot of fossil fuel could flow, for instance, to Manhattan hedge-fund managers who don’t.)
The other extreme would involve no such transfer. Instead, consumers would completely avoid the tax—and thereby eliminate all emissions—by choosing only non-fossil-fuel energy sources instead of the fossil-fuel sources that without the tax would have been less expensive. As a consequence consumers would have less to spend for things like kids’ braces and attic insulation: the current general standard of living would be lower.
In theory, that current sacrifice would be compensated for by (the present value of) avoided future economic damage—if the tax level were set correctly. But setting it correctly is problematic; it depends on how much future damage the present sacrifice would prevent, and that’s unknown. Indeed, we don’t really even know the sign of that quantity; there are reasons to believe that increased carbon-dioxide concentration will actually be a net benefit.
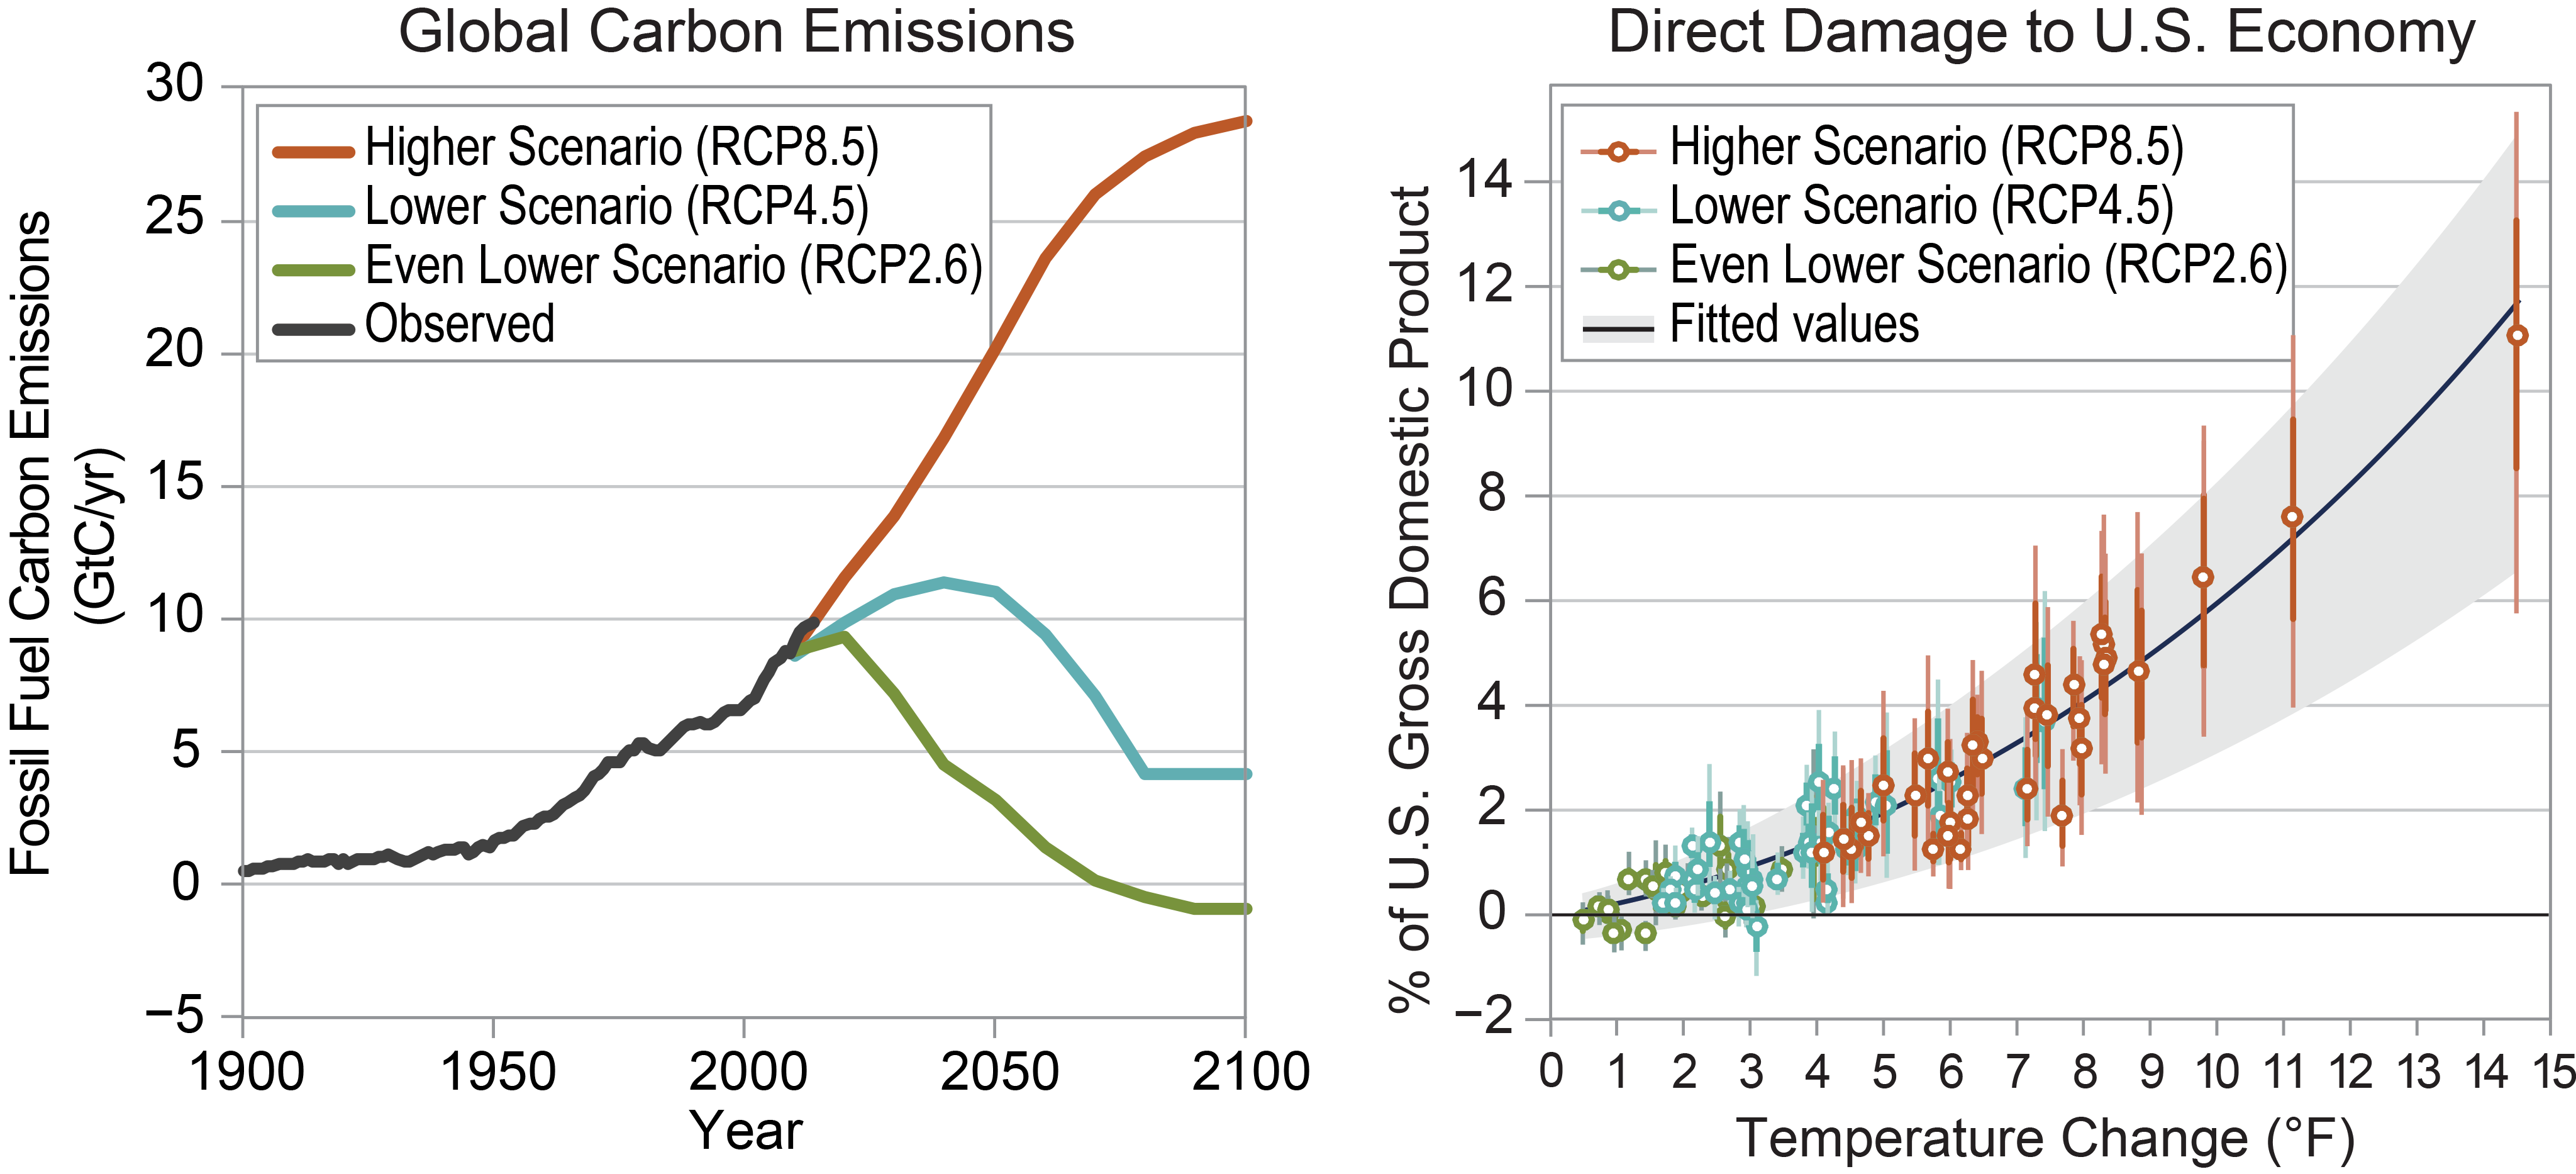
Plenty of guesses have been made anyway, though, and the 2018 U.S. National Climate Assessment selected several for its Fig. 29.3. Fig. 9 below is an excerpt, which expresses the selected guesses in terms of percentage reduction in year-2100 gross domestic product (“GDP”):

In reviewing Fig. 9 remember Dr. Koonin’s observation: “The processes for drafting and reviewing the climate science assessment reports do not promote objectivity.” We’re entitled to suspect that the selection process tended to suppress estimates that base temperature projections on actual observations instead of Fig. 6-type computer-model outputs.
So a carbon tax based on such estimates would probably be too great to be justified by the future damage it would really prevent. Since the estimates vary so widely, in fact, the error alone would quite likely exceed the potential damage. And beyond all those uncertainties is the fact that tax rates based on such long-range estimates are so sensitive to discount-rate assumptions that they’re essentially arbitrary: you can get just about any value you want.
But a further and possibly more-important reason not to adopt a carbon tax arises from its inter-generational nature. To explain this reason we start with per-capita GDP as calculated from the St. Louis Fed’s GDP and population data:
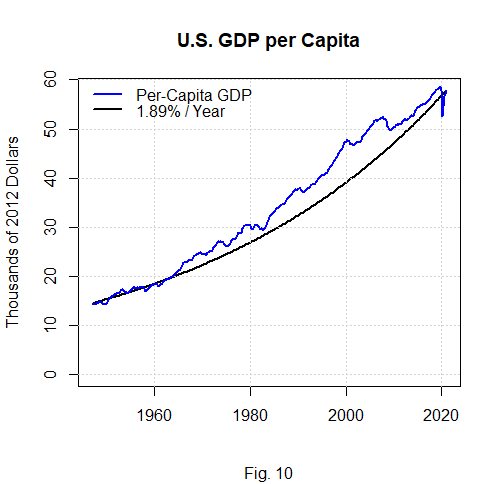
Fig. 10 shows that this century’s dot-com-bubble burst, sub-prime-mortgage collapse, and pandemic shutdowns reduced the illustrated period’s overall rate of per-capita-GDP increase to about 1.89% per year. Fig. 11’s solid black curve projects that reduced rate to the year 2100:
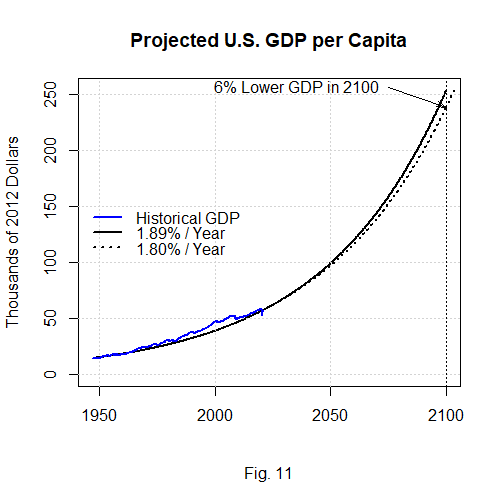
Fig. 11 also includes a dotted curve, whose rate of increase yields a year-2100 value that’s 6% lower than the black curve’s. Remember in this connection that most of Fig. 9’s guesses based on the more-likely RCP4.5 scenario fell below 2%, while nearly all the guesses that exceeded 3% were based on the implausible RCP8.5 scenario.
Even under RCP8.5, moreover, all but three guesses were less than the 6% distance between the curves. So the effect of carbon-dioxide abstinence would almost certainly be less than those curves’ difference—and their difference constitutes less than a four-year delay in the dotted curve’s reaching the black curve’s year-2100 level.
Now let’s step back and look at the big picture: even at the lower growth rate people in 2100 would be more than four times as wealthy as their current-day great-grandparents. Moreover, we have little concept of what kinds of benefit such a wealth increase would confer eighty years from now. So we’re basing current policy on things we’re almost totally ignorant about.
But here’s a thought experiment. Suppose we had a time machine that could take us back eighty years. Eighty years ago there were no jet airliners or television networks, and fewer households had telephones than today have Internet. There were no transistors and virtually no plastic. Polio and tuberculosis were common, and refrigerators were not.
Could we in good conscience ask that people living in such circumstances reduce their standard of living to increase ours? Of course not. Yet imposing a carbon tax on ourselves would be tantamount to carrying out the wishes of great-grandchildren so self-centered that they would demand such a sacrifice to obtain a small and largely speculative benefit.
Our impressions of the current climate and its inevitable change’s likely effects have been grossly distorted. That’s the conclusion that any fair-minded reading of Dr. Koonin’s book compels. Moreover, the massive uncertainties it reveals should open our minds to some important questions.
Again, for instance, why shouldn’t we believe that present-day fossil-fuel abstinence would impair our current quality of life far more than it would enhance our great-grandchildren’s? And, since the current interglacial period has become long in the tooth, how much evidence is there really for the proposition that fossil-fuel use is any more likely to cause a climate catastrophe than to delay one?
For too long media-market forces have conspired with the desire for political and scientific-career advancement to suppress such questions. Sen. Braun has received admiring press for his “climate leadership.” But true leadership would be to ensure that such questions get considered thoroughly before any more climate legislation is adopted.
A good first step would be to read Dr. Koonin’s book.