

Spreadsheet Rocket Science, Part 3
Spreadsheet Rocket Science, Part 3
Trajectory Calculations
The two previous posts presented spreadsheet exercises by which readers could show their kids how to make simplified rocket calculations.
The first post dealt with the ratio that a rocket’s total, payload-plus-propellant launch mass bears to the mass of its payload alone. It showed that this ratio is an exponential function of the velocity to which the payload is to be driven. The second post then showed why the velocity to which an orbital payload must be driven is very high indeed.
But the billionaires’ flights that prompted these posts were sub-orbital, so their rocket velocities didn’t need to be that high. By reference to the following spreadsheet this post therefore describes how (if certain details were available) a ballistic model might be used to estimate a sub-orbital flight’s propellant requirements.
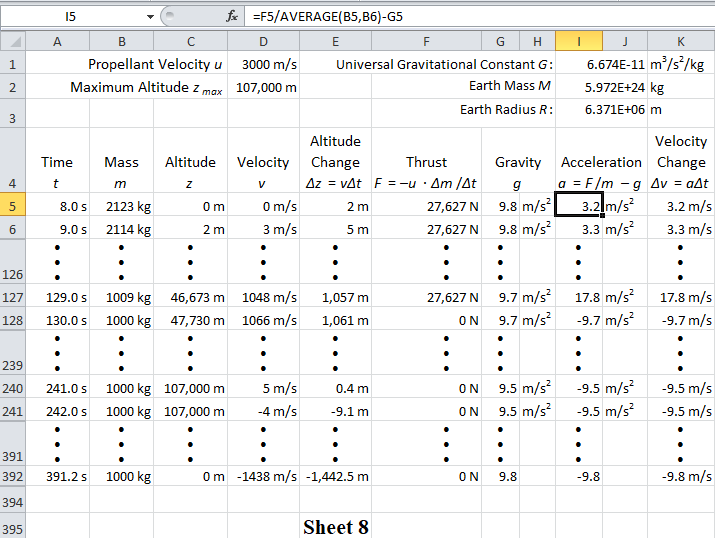
Sheet 8 differs from the first post’s Sheet 1 in that Sheet 8 takes gravity into account. Specifically, Column G calculates gravitational acceleration g by using the gravity formula described in the previous post:

and Column I calculates the rocket’s acceleration by subtracting the resultant g value from the acceleration that would otherwise result from the rocket “thrust” calculated in Column F.
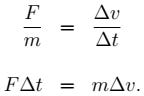
Thrust is the term for the force F that a rocket motor applies. According to Newton’s Second Law the acceleration that a force F causes a mass m to undergo in the absence of other effects equals the ratio F/m that the force bears to the mass. This no-gravity acceleration value F/m is therefore what Column I subtracts the gravitational acceleration g from to calculate the rocket’s net acceleration.
To understand how Column F calculates the thrust value F used in Column I, remember that acceleration is the ratio Δv/Δt that a change Δv in velocity v bears to the length Δt of the time‑t interval over which that change occurs. We can therefore write an expression for the no-gravity acceleration F/m and rearrange it as follows to express the relationship between a mass m’s momentum change mΔv and the time Δt over which the thrust F is applied to it:
But if the effective exhaust velocity is u we know that in the absence of gravity and drag a rocket’s momentum change mΔv would equal the momentum uΔm acquired by the quantity Δm of propellant expelled to produce that change. From this we obtain the expression that Column F uses to calculate the thrust value:
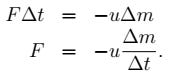
(We included negative signs in those equations’ right-hand sides because the difference values Δm between successive Column B values are negative.)
To calculate the velocity change over a given time interval, Column K multiplies Column I’s net-acceleration value by the interval duration Δt. Column I therefore uses the mass’s average over the interval to calculate that value, as the top-left spreadsheet window’s formula illustrates for Cell I5. The velocity that Column E uses to calculate the interval’s altitude change is a similarly calculated interval average.
Since the quantity of interest, namely, how much propellant is required per kilogram of payload, is a ratio rather than an absolute magnitude, we were able to choose the payload mass arbitrarily. The payload’s arbitrarily chosen mass, 1000 kg, can be inferred from Cells F128 and B128: the thrust drops abruptly to zero when the craft’s 1000‑kg mass indicates that its propellant has been exhausted. (The unit of force used to express Column F’s thrust is the newton (“N”), which is the force required to accelerate one kilogram one meter per second per second.)
As Cell D1 indicates, we also assumed (only a little less arbitrarily) that the propellant velocity u is 3000 m/s. (We haven’t yet located reliable information about that quantity, so here we just used the value that one site professes to know for Blue Origin’s BE-3 engine.) We then “tuned” the model by so choosing values of initial mass and (for the sake of simplicity a single, constant) propellant mass flow as to match the trajectory defined by the telemetry that the Blue Origin video portrayed.
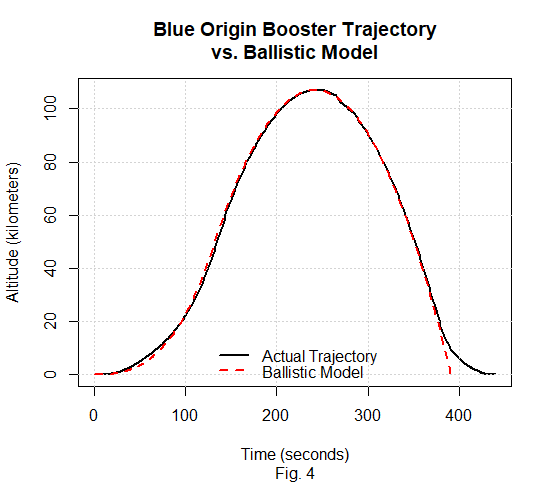
Fig. 4’s solid black curve represents the displayed telemetry data. At about 135 seconds into the flight the engine cut off, and not long after that the rocket booster separated from the passenger capsule. The displayed telemetry continued to report on the now-separated capsule until 269 seconds into the flight. Then the display switched to the booster’s telemetry in order to cover the booster descent and recovery, so a 1.3-km discontinuity may be perceptible in Fig. 4 at t = 269. Although the data thereafter displayed is really booster data rather than capsule data, the switch makes little difference for our purposes.
As the dashed red curve indicates, our model seems to match the data pretty well. Or at least it pretty well matches the data’s high-altitude portion, where aerodynamic effects are negligible. (We didn’t attempt to model lift and drag, so instead of a soft landing at the end of the flight the modeled craft crashed into the ground at Mach 4.) As a comparison of Sheet 8’s Cell B5 with its Cell B128 implies, the mass ratio we used to get the illustrated match was 2.123, so this is a plausible mass ratio for Mr. Bezos’ flight.
Note that this ratio is considerably greater than the 1.43 we get by plugging into Equation 1 the 3000 m/s exhaust velocity from Cell D1 and the 1066 m/s maximum velocity from Cell D128. That’s because Equation 1 deals only with accelerating the craft, whereas our modeled rocket was also opposing gravity.
Like the mass ratio that Equation 1 gives for a rocket accelerating without gravity, the mass ratio for a rocket opposing gravity without acceleration turns out to be an exponential function. But instead of a function of velocity v it’s a function of the time t over which the propellant is expended:
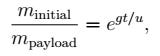
where g is the acceleration of gravity. By evaluating that equation’s right-hand side with a t value equal to the rocket burn’s 122-second duration we get about 1.49 as our no-acceleration ratio. A result of the fact that the propellant flow rate in our simulation was constant is that the 2.123 ratio in our simulation just about equals the product, 2.125, of the no-acceleration and no-gravity ratios.
Now, we’ve unjustifiably dignified those ratios with four significant digits, so this may be a good point at which to remind young scholars that our calculations have produced only rough estimates and that there’s a lot we don’t know. In fact, there are two reasons to believe that the Blue Origin flight’s ratio of lift-off mass to payload mass probably differed significantly from what we just calculated.
The first reason is specific. Because of the real craft’s zero/low acceleration during the first few seconds after the burn started, the simulation delayed its (again, constant-rate) propellant expulsion until eight seconds into the flight. It therefore ignored some of the actual flight’s propellant use. Moreover, the simulation cut the engine off about six seconds before cut-off occurred in real life. So it’s reasonable to suspect that the numerator in our mass-ratio calculation was lower than it should have been.
On the other hand, that low initial acceleration suggests that the propellant-flow rate was slow to reach its maximum. And deceleration began in the data before our simulated motor turned off: the motor apparently throttled back at least twelve seconds before the complete cutoff. Yet the simulation used its maximum propellant-flow rate throughout the burn.
The second reason is more general: Fig. 4’s fit to the data depended on four parameters whose values we chose somewhat arbitrarily. Those parameters are exhaust velocity (D1), starting time (A5), propellant-flow rate (Column B’s rate of change), and the mass ratio we were trying to estimate. Again, moreover, real-life propellant-flow rates can vary during a burn, so that quantity could be considered a high-dimensioned parameter.
It’s therefore almost certain that with a different combination of the other parameters a different mass ratio could have resulted in at least as good a fit to the observed data as Fig. 5 depicts; as John von Neumann reportedly said, “With four parameters I can fit an elephant, and with five I can make him wiggle his trunk.” If we had instead taken the propellant velocity to be the 4300 m/s value we used before, for example, we could just as plausibly have concluded that the Blue Origin flight’s mass ratio was more like 1.7, a value that implies only about six-tenths as much propellant. So there’s quite a range of uncertainty.
Although that uncertainty conspires with others to prevent us from comparing Mr. Bezos’ propellant use very accurately with Mr. Branson’s, let’s inventory what we know. Mr. Branson’s RocketMotorTwo is reported to generate 310 kilonewtons (“kN”) of thrust, and its burn lasted for one minute. In contrast, Mr. Bezos’ BE3 motor reportedly generates 490 kN, and its burn’s duration was something over two minutes. This suggests that Mr. Bezos’ flight required over two and a half times as much propellant as Mr. Branson’s if we take the exhaust velocity of Mr. Branson’s hybrid motor to be 2450 m/s instead of the 3000 m/s we’ve accorded Mr. Bezos’ hydrolox motor.
Beyond being based on uncertain exhaust-velocity values, however, that comparison ignores the fuel used by the mother ship that carried Mr. Branson’s rocket plane to its 14-km launch altitude. The mother ship carried the rocket for about forty-five minutes before launching it. True, some of this time was no doubt spent merely in positioning the rocket optimally for its glide path home; the mother ship reached the launch altitude and speed about fifteen minutes before launch. Conceivably, though, reaching the launch altitude and speed at maximum thrust could still have required as much as thirty minutes, i.e., over twenty times as long as it took Mr. Bezos’s flight to reach the altitude of Mr. Branson’s launch.
Still, Mr. Branson’s mother ship is a jet rather than a rocket, so it doesn’t have to carry its own oxidizer, and its oxidizer could weigh nearly three and a half times as much as its fuel. Together with the fact that non-combustion-product air can contribute to a jet engine’s thrust, this means that for a jet the effective exhaust velocity—defined as the ratio of the jet’s thrust to the flow rate of the propellant the jet actually carries—could easily be ten times what it is for a rocket.
Also, the mother ship’s reported 123 kN of thrust is only about a quarter of what Mr. Bezos’ rocket has to generate. Combined with the jet’s effective exhaust velocity, this could mean that for a given duration Mr. Branson’s mother ship doesn’t need to carry any more than 3% as much propellant as Mr. Bezos’ rocket. But uncertainties in the values that this calculation is based on make our comparison murky.
With more effort we might have been able to nail those values down. But even without them our application of math to what little we know has helped us identify what further information would be helpful. And it has shown how much important information the two billionaires’ two-hour-long videos left out. Similarly applying math to other things kids read and hear can enable them to see how news reports often omit the most-important facts.
Beyond giving kids something interesting to apply their math to, these posts should also impart a sense of what physics is about and maybe hone their spreadsheet skills. Perhaps it will also make them want to take more math and science.
Fig. 5, for example, illustrates the type of thing they could try once they’ve mastered trigonometry and analytic geometry: investigating whether those billionaires’ rocket designs could be applied to rapid inter-city flights.
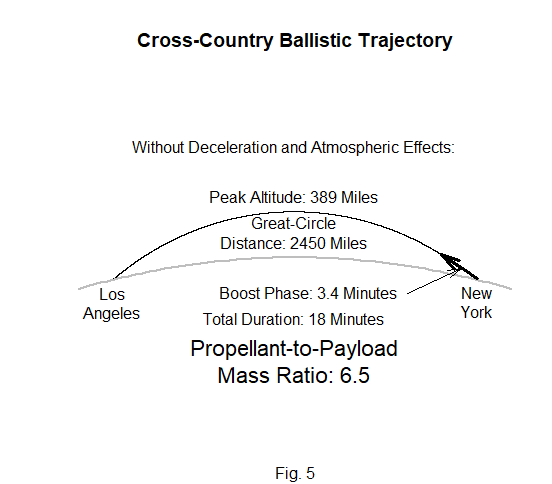
We won’t describe Fig. 5’s calculation in detail, although it was nearly as simplistic as those we described previously. In particular, it ignored atmospheric effects and the need to decelerate. But even though the results are therefore undoubtedly inaccurate they provide some sense of minimum propellant requirements.
Since the Fig. 5 calculation ignored the atmosphere the simulated rocket didn’t launch straight up, as real-life rockets do in order to reach rarer atmosphere while their speeds are still relatively low. Instead, it launched the rocket at an angle in a constant-3‑g boost phase long enough for a craft launched from New York thereafter to coast to Los Angeles.
Such an acceleration profile would require an engine more powerful—and capable of more throttling—than designers would probably choose for such an application. The calculation also had the craft slam into the ground at over 12,000 mph even though in real life the atmosphere would slow it to a much lower speed, from which, say, parachutes would further slow it to a soft landing.
So a realistic flight’s duration would be somewhat greater than the calculated 18 minutes. Even so, we can probably be confident that a ballistic rocket trip would take much less time than the hour and a half a supersonic Concorde flight would have required. (And since most of the trip takes place above the atmosphere it wouldn’t inflict a sonic boom on everyone who lives along its flight path.)
For that calculation we again assumed the 3000 m/s exhaust velocity we used in Sheet 8. With that assumption we found that the propellant would have to weigh 6.5 times as much as the payload, i.e., 6.5 times as much as the craft, crew, passengers, and luggage. (In comparison, a Boeing 747’s fuel-to-payload ratio is less than 1.0.) And the Fig. 5 calculations ignored the earth’s rotation, which would increase the ratio of the flight to Los Angeles but decrease that of the return flight to New York.
We hasten to add that like most preceding calculations this one is sensitive to assumptions. If we had instead used the 4300 m/s exhaust velocity we assumed elsewhere, for example, the ratio would have been only 3.1. And perhaps a different trajectory could have reduced the ratio further.
However that may be, calculations like that of Fig. 5 require trigonometry and are best performed in polar coordinates, so they provide high-school students a reason to study analytic geometry as well as trigonometry. Also, although the Fig. 5 calculation could have been done on a spreadsheet, its greater complication would have made mastering a scripting language like Python preferable.
Such problems could also incentivize kids to study some physics. Alert readers will have noticed, for example, that none of these posts mentions the concept of energy, which would of course come in handy even though the Fig. 5 calculation doesn’t absolutely require it.
And, although these posts haven’t required any knowledge of higher math, it can’t have escaped the reader’s attention that higher math is actually what these posts are based on. Fig. 5’s calculations, for example, are based on the following differential equations:
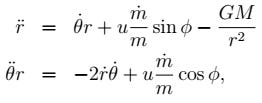
where φ is the exhaust velocity’s angle with the horizontal. So these exercises may provide kids an incentive to take college math courses. And other questions raised by thinking about rockets may inspire them to pursue college-level science.
One such question is why orbital vehicles don’t avoid high-maintenance heat shielding by using retro rockets—or, as Mr. Branson did, by using drag and lift—to slow the craft down before the atmosphere gets thick enough to make re-entry heating a problem. Actually, we already have part of the answer: slowing an orbital vehicle down requires almost as much propellant as speeding it up does, so using retro rockets would nearly double the velocity change that goes into our exponential mass-ratio equation. Since exponent addition is equivalent to multiplication, this means that retro-rocket use could increase a mass ratio of, say, 10 to something on the order of 100.
But the drag-and-lift part of the question is harder. Drag and lift are proportional to air density just as heating is, so at first glance they’d seem to be a plausible way to reduce speed on re-entry before the air has become dense enough to make heating a problem. Indeed, Naptown Numbers doesn’t profess to have the complete answer to this question. However, whereas drag and lift increase as the square of velocity, the phenomena that contribute to heating apparently increase even faster.
Take heating by radiation from the plasma that forms just ahead of a re-entering orbital craft’s forward surface. This radiation increases as the fourth power of the plasma’s temperature—which in turn increases with the craft’s velocity. So at lower speeds such radiation is negligible even in atmospheric densities where drag and lift are significant, yet at orbital speeds it’s a problem even in atmospheric densities where there’s essentially no lift or drag.
Obviously, understanding the answer completely would require quite a bit of fluid-mechanics and radiation-physics knowledge. That’s an incentive for kids who are interested in this stuff to get high-school grades good enough for acceptance into college courses where it can be studied.
Of course, aerospace engineering isn’t for everyone. But the experience of applying the math they know to a subject usually considered the preserve of experts can benefit kids in many pursuits.