
Will Batteries Make Wind and Solar Reliable?
Not if Texas wind data are any indication
Introduction
Although a recent Wall Street Journal piece left room for interpretation, it seemed to invite the impression that battery prices will soon be so low as to enable wind and solar farms to produce base-load power more cheaply than fossil-fuel or nuclear (“thermal”) plants can. Yes, certain timing mismatches between electricity generation and demand have provided niche applications for batteries. But base-load power sounds like a heavy lift. If our legislators and regulators get that issue wrong, moreover, it could adversely affect not only our electricity bills but also our factory jobs and the cost of a great many things we buy.
So when I happened upon hourly wind data from the Energy Reliability Council of Texas (“ERCOT”) I thought they might provide a good basis for a little sanity check. That exercise turned out to involve a lot of guesswork. As I’ll explain presently, though, those data seemed to say that battery prices won’t likely be the cause if thermal plants get eliminated.
Purportedly Competitive Wind and Solar
As background let’s first review the popular belief that wind and solar are price-competitive already. The Energy Information Administration (“EIA”) estimates that for a combined-cycle gas-turbine (“CCGT”) generator the “levelized cost of energy” is $36.61 while for onshore wind it’s only $34.10. In a constituent meeting my state representative based his energy-legislation position on wind’s and solar’s purported price advantages. A local go-to academic economist assured us that “Electricity production through the use of renewable energy sources (wind and solar) are now lower than the cost of natural gas or coal.”
Moreover, I drive through a 17.5-MW solar farm on the way to the Indianapolis airport. Wind farms flank the road from Indianapolis to Chicago. And the Northern Indiana Public Service Company (“NIPSCO”) says that by 2030 it will have reduced its greenhouse-gas emissions by 90% from their 2005 level. So a lot of people say those technologies are already competitive, and a lot of money seems to be saying it, too.
But there are at least three reasons for skepticism. The first is just that wishful thinking seems to afflict the whole field of “green energy.” When a British researcher recently based a study on actual audited capital and operating costs, he found that the widely held belief in falling capital costs is simply wrong. Having investigated most large British wind farms, he found that their overall costs had not fallen significantly in two decades.
The second is results. If wind and solar are already competitive, why do they continue to be propped up by subsidies and mandates? And why do the jurisdictions that have embraced renewables most enthusiastically seem to have the highest energy prices?
An LCOE Calculation
The third, which a simplified example will illustrate, is that most levelized-cost-of-energy calculations don’t adequately take reliability into account. The illustration starts with the EIA estimate of CCGT generators’ overnight cost of procurement, engineering, and construction. Those costs vary widely with things like the local labor market and regional transportation, but as an average the EIA arrived at $957 per kilowatt of nameplate capacity. For the sake of simplicity we’ll assume all-debt financing for a 30-year term at the 4.3% rate considered by the EIA to be the “weighted-average cost of capital.” That puts debt service for a megawatt of nameplate capacity at $57,380. Adding an EIA-estimated $12,260/MW in annual fixed operation-and-maintenance cost yields a fixed-cost total of $69,640.
To translate that into a value per megawatt-hour, we’ll use the ERCOT data:

According to those data the ERCOT territory’s load variation requires that the system have enough capacity to generate 1.7 times the average load. Also, we’ll (no doubt pessimistically) interpret the EIA’s CCGT-capacity-factor estimate as meaning that CCGTs are available only 87% of the time. This will imply that the annual fixed cost of enough CCGT plant to average a megawatt of electricity is 2 times the cost we calculated above for that much nameplate capacity. Applying that multiplier and dividing by 8760 hours per year gives us $15.58 per megawatt-hour. To that we add $1.88/MWh in non-fuel variable expense for a total cost of $17.46/MWh before fuel expense.
The EIA estimates that CCGTs have to burn 6370 BTUs’ worth of natural gas in order to generate a kilowatt-hour of electricity. If the natural-gas price is $2.89 per million BTUs, then we have to add $18.41 in fuel cost, for a total of $35.87 per megawatt-hour. Our use of the ERCOT data presumably contributed to the difference between this figure and what the EIA came up with, but our fuel-price assumption and simplified financing terms were probably factors, too.
Now we turn to wind. For wind turbines generally the EIA overnight-cost estimate is $1846 per kilowatt of nameplate capacity. But here we’ll instead use the $1232/kW value that the EIA gives for onshore wind alone.
To calculate a cost per megawatt-hour from that value we’ll be giving the ERCOT wind-energy data an interpretation that may not be entirely correct. Those data presumably represent the wind energy the grid accepted, whereas what we’ll be interested in is the total energy the wind turbines could have supplied if the grid had accepted it all. Treating the former as the latter may bias our calculation against wind, but my guess is that the grid accepted almost all that energy and that any difference between the two quantities is therefore minimal. Also note that the calculations favor wind by not including the additional transmission-line cost that wind turbines impose.
A few other hourly wind-power records can be found, but one of the reasons why I chose the ERCOT data set is that it includes figures for installed wind-turbine capacity. In accordance with the interpretation we’re giving the wind-production numbers those figures indicate that it took 2.7 megawatts of nameplate capacity to average one megawatt of wind power. If we employ that factor together with $1232 as the initial price and $26.47 as the annual fixed operation-and-maintenance cost of a kilowatt of nameplate capacity, then using the same financing terms we did for CCGTs gives us $31.23/MWh as the price of wind energy. That’s less than the $35.87/MWh value we calculated for CCGTs. Seemingly, therefore, it justifies the contention that wind has become competitive in cost.
The Cost-Structure Problem
But there’s a cost-structure difference that makes it misleading to compare individual cost-of-energy values. Specifically, fossil-fuel plants are self-sufficient; reliable power generation requires nothing further. This means that for CCGTs we calculated the whole cost. In contrast, wind turbines need to be backed up; they don’t generate when the wind isn’t blowing. The comparison we made above didn’t take this backup expense into account.
The ERCOT data illustrate the magnitude of this problem: they indicate that wind power actually fell to as low as 0.6% of installed capacity. Combining wind with solar would increase that minimum, but not enough to change the fact that the backup requirement is nearly 100%. Now, one might speculate that the wind-power minimum would be higher if power were aggregated from wind turbines spread over a greater geographical area. But ERCOT covers most of Texas, which is greater in area than all of New England and probably has more of the high-voltage-transmission lines that wind-power sharing requires. So it seems unlikely that such further aggregation as is practical would have a significant effect.
The unfortunate result is that although adding wind and/or solar capacity to a previously all-fossil-fuel system lowers the fossil-fueled plants’ variable cost it reduces virtually none of their fixed cost. In our calculation adding $31.23/MWh wind generation reduces CCGT plants’ variable cost by only $20.29/MWh: adding more wind capacity results in a net cost increase.

Fig. 2 illustrates that cost-structure problem. Although the wind-turbine cost represented by its right-hand bar’s bottom segment is less than the CCGT cost represented by its left-hand bar, that comparison doesn’t take into account backup costs, which the right-hand bar’s top two segments represent. This false comparison perversely drives the system to a higher-cost mix if wind and solar generation isn’t held to the reliability standard that thermal generation meets.
Of course, a lot of the quantities that went into that calculation are subject to considerable variation. Before fracking, for instance, gas prices were often high enough to exceed current wind-turbine costs, and large gas-price spikes still occur sometimes. But the point is that fossil-fuel opponents usually compare the wrong costs. Until they can demonstrate that on average fossil fuels’ variable costs will exceed what wind and solar cost without backup they haven’t made their case.
Diminishing Returns
The case for wind is actually worse than our $31.23/MWh value implies, because that value applies only to low levels of wind-power capacity. When wind-power capacity becomes high enough that the wind turbines’ output sometimes exceeds the load, its cost per megawatt-hour increases. To see why, let’s scale the wind capacity up enough to make its average power equal the average load:

As Fig. 3 shows, the wind power could often exceed the demand even though on average it only equals it. Without storage, that extra power would go to waste. So as wind capacity gets higher a given increase in nameplate capacity results in a lower increase in power actually used: without storage, increasing wind capacity at higher penetrations increases wind’s cost per megawatt-hour.
In the Fig. 3 scenario the bottom segment of Fig. 2’s right-hand bar represents only the wind turbines’ cost per megawatt-hour of total load, not per megawatt-hour of just the load portion that the wind turbines actually drive. The wind-turbine capacity assumed for that bar could supply the entire load if wind’s timing matched the load’s. Again, though, some of the turbines’ potential goes to waste when wind capacity is that high; in reality the grid can use only 74% of that potential. So instead of the illustrated $31/MWh the wind turbines actually cost $42 per megawatt-hour of the wind-turbine output the grid can actually use. But wind retains its (illusory) advantage because the corresponding figure for the backup-providing CCGT plants increases to $80 per megawatt of backup energy.
Enter Batteries
The Wall Street Journal piece described ways in which batteries could change this situation. Batteries have already started being used, it said, to “bank electricity during the day” and then “discharge power as needed for a couple of hours in the evening when power demand rises, along with prices, after the sun sets.” That practice has apparently been reducing the amount of peaker operation in conventional plants, i.e., of making those plants follow rapid changes in demand.
Peaker operation is distinguished from base-load operation, i.e., from operating at more or less a steady rate and therefore more efficiently. Batteries tend to shift fossil-fuel operation from less-efficient, peaker operation to more-efficient, base-load operation, whereas wind turbines tend to do just the opposite. Moreover, batteries can reduce the waste that would otherwise occur when wind-turbine capacity becomes substantial:

The Fig. 4 curves’ left portions show that the cost of adding more wind power equals the above-calculated average cost when wind-power penetration is low. As we observed above, though, wind-turbine capacity begins to get wasted when penetration increases to the point at which wind turbines sometimes generate more than the grid can use. The green curve shows that battery storage can reduce this effect.
But that’s a reduction not in overall cost but only in marginal cost: in the amount by which expenses increase with capacity after the batteries have already been paid for. The Wall Street Journal piece reported that battery prices had fallen to $125/kWh, and it quoted an expert as saying that prices could eventually bottom out at a value as low as $80/kWh. Even at that speculatively low $80/kWh price the depicted 6 hours’ worth of batteries increases the overall cost by $3.09/MWh at low penetration and $1.02/MWh when penetration is high enough for wind power to average the mean load.
Lots of Them . . .
The Wall Street Journal passage could nonetheless cause an unwary reader to conclude that such battery prices will additionally enable wind and solar farms to provide base-load power competitively with thermal plants. Now, it doesn’t state that conclusion precisely:
“Developers and utilities are looking at another evolutionary step in the industry: building batteries to harvest and dispatch inexpensive and clean power from wind and solar farms, and not just for a couple of hours after sunset. That threatens not only peakers, but many traditional power plants financed under the assumption that they would be able to competitively sell electricity at all hours of the day for decades.”
But we’ve already seen that even without batteries relegation to backing wind turbines up can prevent a thermal plant from meeting debt service that base-load operation would have enabled it to cover. We’ve also seen that even without wind turbines batteries would tend to promote base-load operation. So by combining batteries with wind and solar farms the quoted passage seems to be predicting something further, and nothing in the piece discourages the impression that wind backed up by batteries will soon be cheaper than base-load thermal plants.
But that impression is false if the ERCOT data are any indication. We can see this by using those data to simulate storing excess wind energy in batteries that then drive the load when wind falters. To that end we’ll calculate the cumulative difference between the load and scaled-up wind-power data:

Since we’ve scaled the wind-power data up to meet the whole year’s energy demand, the batteries start and end the year with the same amount of stored energy, and the Fig. 5 curve represents the cumulative difference translated upward by enough initially stored energy to avoid being caught in late fall without enough backup energy. What Fig. 5 tells us is that 957 hours’ worth of storage would be needed to back up wind turbines whose average output exactly equals the mean load.
That would be a problem. At the predicted battery price of $80/kWh, backup for one megawatt of average power would cost $77 million. If we assume a 30-year term for all-debt financing at our 4.3% real interest rate, that comes to $4.6 million annually in debt service, or $520/MWh.
. . . Or More Wind Turbines
Obviously, that price is exorbitant. Fortunately, it drastically overstates the problem. It’s based on the assumption that the wind capacity is only great enough to supply the average load. With more wind capacity than that the batteries get charged faster and don’t need to drive the load as much. The storage requirement therefore diminishes greatly as capacity increases:
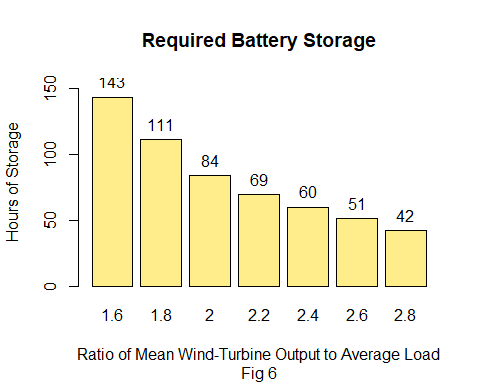
Unfortunately, wind-turbine cost increases as storage cost decreases:
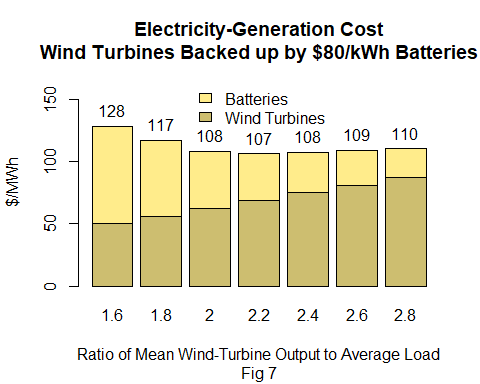
Fig. 7’s $107/MWh minimum results from providing enough wind turbines to generate an average output that’s 2.2 times the average load—i.e., a total nameplate capacity of about 6 times that average—backed up by 69 hours of battery storage. Although that cost is lower, it’s still prohibitive.
Caveat
I hasten to add that the minimum cost we just arrived at might have been lower still if we had combined those wind data with corresponding solar data. Depending on latitude and climate, solar tends to require more storage than wind does, but an optimal combination of both can require less storage than either alone. ERCOT makes its solar data less convenient to obtain than its wind data, so we won’t do a combination calculation for Texas. We should nevertheless note that the storage-requirement difference can be substantial. Scaled up to average the mean load, for example, the 2016 values one source gives for German wind turbines and solar panels would individually have required respective storage values of 1205 and 2583 hours. Only 449 hours are required if two-thirds that much wind capacity is combined with one-third that much solar.
That’s a big difference, but the German data suggest that the resultant cost difference wouldn’t be big enough to affect our overall conclusion. Probably because Germany isn’t as big and windy as Texas a Fig. 7-type calculation based only on German wind data yields a cost minimum of $158/MWh for wind only. That results from an average capacity of 1.8 times the mean load, which requires 119 hours of storage. Switching instead to a 2:1 combination of wind and solar yields a cost-optimized capacity of 1.4 times the mean load, requiring 107 hours of storage. The resultant cost is $137/MWh: lower, to be sure, but not game-changing.
Used Batteries
Now, some commentators have pointed out that if electric vehicles take over they will create a large market in used batteries. Then the price that electric utilities have to pay for batteries could be less than what the batteries cost to make. So let’s suppose that used batteries cost only, say, $35/kWh:

Although we lowered the battery price by 56%, Fig. 8’s $88/MWh minimum is only 18% less than the Fig. 7 value. That’s because the reduction of only 9% in wind capacity and cost required a 21% increase in storage capacity, to 84 hours. So it may be instructive to consider what kind of used-battery market that much storage might imply.
We’ll assume the extreme case in which all transportation and electricity generation are completely fossil-fuel free, and we’ll start with the supply of used batteries. The Bureau of Transportation Statistics reported that 3.3 trillion vehicle-miles were traveled in 2019. Suppose that batteries have to be replaced every 100,000 miles and that cars’ battery sizes average 100 kWh in initial capacity. If 70% of that capacity remains when they’re replaced, that comes to 2300 GWh per year in used-battery supply.
Now let’s estimate the demand. According to the EIA, the United States generated 4100 billion kilowatt-hours of electricity in 2019. Let’s subtract 290 billion for hydroelectric and geothermal and add the 1100 billion it would take to charge electric cars that travel 3.3 trillion miles at an average of, say, 3 miles per kilowatt-hour. Dividing the result by the number of hours in a year gives 560 million kilowatts of average power that would need to be backed up. That means the above-determined 84 hours of energy comes to 47,000 GWh. In the Fig. 8 calculation we assumed a 20-year financing term for used batteries. If we similarly accord them a 20-year life in backup service, then 2300 GWh of used batteries would need to be bought each year.
Under those assumptions, that is, our $35/kWh value turns out to be the market-clearing price; at a lower price utilities would save money by backing up fewer wind turbines with more batteries, but then the battery demand would exceed the supply and drive batteries’ price back up. And that’s without taking into account the price pressure that so much battery manufacture would cause the raw-materials market to exert.

So our $35/kWh price seems wildly optimistic but, as Fig. 9 illustrates, comes nowhere near to making batteries competitive.
Conclusion
Again, the foregoing calculations involved a lot of guesswork, so we can’t put much stock in the specific values it produced. Also, results based on different locations would be different. But we didn’t find batteries close to competitive even though we used not only presumably favorable Texas data but also battery prices lower than any I’ve seen predicted. So although batteries no doubt will enjoy some niche applications it’s unlikely that they’ll very soon provide a general solution to wind and solar’s reliability problems.
$35/kWh may be a reasonable price for a used battery sitting on a pallet somewhere. But that battery requires a whole host of sophisticated electronics to be converted to a functional "packet" (not the least of which is fire suppression), sitting on a larger pallet. the price is now say $45/kWh? A reasonable price for siteing, assembling the packets in parallel and connecting to the grid and the windfarm will double the price. Likewise, the $80/kWh new battery price is without packaging and connections. No honest person will project the installed cost "someday" at less than $160/kWh, or less than $200/kwh with new batteries, $100 kWh with used batteries for installation in 2021-2022. Hopelessly expensive, give it up: N2N. See NuScale SMR's & TerraPower, Bill Gates' molten salt reactors, both scheduled for operation yet this decade if you're afraid of CO2 (plant food), otherwise CCGT for at least the next 30 years.
Battery cells have reached the 100 USD/kWh threshold at the end of 2020, and continue to decline. The new Na ion batteries are projected for 40% of the price of a Li ion battery. This will be a game changer.
I think, we need a re-calculation in 2-3 years.