

14,630,253 Metric Tons
14,630,253 Metric Tons
Carbon Dioxide with a Side of Context
The Thrive Indianapolis plan issued in 2019 by the administration of Indianapolis mayor Joe Hogsett presents one of those boxcar numbers that seem to demand action: 14,630,253 metric tons of carbon dioxide. But, like many numbers we read in newspapers and see on television, this one lacks the context that would tell us whether it really demands the action it seems to.
Superficially, of course, its meaning is perfectly clear. The plan presents “59 ambitious but achievable actions” directed to the goals of achieving “carbon neutrality by 2050” and increasing “community resiliency.” Since 14,630,253 metric tons is the quantity of carbon dioxide to which the plan’s page 24 says Indianapolis’s 2016 greenhouse-gas emissions were equivalent, it’s presumably the net emissions reduction needed to reach the carbon-neutrality goal.
But the reason for that goal is to reduce global warming. Yet the plan gives no estimate of how much global warming would be avoided by reaching that goal. And that’s a problem, because many of the plan’s emissions-reduction actions are expensive. They include expanding the city-bus company, for example, as well as things like using renewable energy for government operations, subsidizing loans for buildings’ energy-efficiency and renewable-energy work, expanding green spaces, increasing so-called transit-oriented development, curbside composting and recycling, building a microgrid, and making all city buses electric.
Money thus spent in an attempt to avoid warming is money that can’t be spent on other things—such as air conditioning for dealing with the hot days that will come whether we abstain from emissions or not. Shouldn’t we have some basis for evaluating that trade-off? Shouldn’t we know how much warming all this expense is likely to avoid? Newspapers, television, and our governments too often withhold the context that such judgments require.
So we laymen need to seek that context ourselves. We may not know climate science, but we do know some things. Like high-school math. And in this case we can apply it to one of the widely published estimates of carbon dioxide’s temperature effect.
Such estimates vary widely, of course. In particular, those based on actual observation tend to indicate that carbon dioxide’s temperature effect is modest. Higher estimates tend to come from computer models; they’re mostly written by people whose jobs depend on public fear of global warming. Here we’ll take our value from the higher, model-generated estimates.
Specifically, we’ll use an equilibrium-climate-sensitivity (“ECS”) value of 5.4°F. ECS is the change in global-average surface temperature that a model says doubling the atmosphere’s carbon-dioxide concentration would ultimately cause. (ECS is expressed in terms of temperature change per doubling rather than per unit concentration change because the effect is logarithmic: the temperature-change result of the 500-ppm increase between 500 ppm and 1000 ppm is the same as that of the 250-ppm increase between 250 ppm and 500 ppm.) Page 16 of the Working Group I Summary for Policymakers in the IPCC’s Fifth Assessment Report gives the ECS range as 1.5–4.5°C, or 2.7–8.1°F, per doubling of carbon-dioxide concentration. 5.4°F is the mid-range value.
Let’s call that 5.4°F ECS value S, call the 3210-gigatonne value we find when we look up total atmospheric-carbon-dioxide mass M, and use the symbol m for the mass of the contribution Indianapolis would make if its emissions remained the same through the end of the century. Only about half of our carbon-dioxide emissions show up as atmospheric increases, so for m we’ll use the product of eighty years and half the Thrive Indianapolis value.
By using those values we can assign an upper bound to the end-of-the-century temperature difference ΔT in which eliminating all Indianapolis emissions would result. That bound is obtained in a simple spreadsheet calculation according to the following formula:

where the number of doublings is expressed mathematically as the base-two logarithm. The result will be an upper bound because over this century China, India, and other countries will reduce the effect of the Indianapolis contribution by driving the total content M to a value higher than we’ll use in the calculation.

We thereby find that even if Indianapolis stopped all emissions tomorrow the difference through the end of the century would be less than two thousandths of a Fahrenheit degree.
Two thousandths of a Fahrenheit degree. In eighty years. The Indianapolis temperature frequently changes by more than that in ten seconds. Did the Hogsett administration think a temperature difference still imperceptible eighty years from now could justify those expensive emission-avoidance measures?
Maybe not. Perhaps that’s why it omitted the temperature effect. Otherwise it would have been forced to make the risible argument that Indianapolis’s abstinence will cause most other cities, like, say, Delhi and Mombasa, to undertake such expensive measures, too.
Instead, it merely said that “heat is the number one weather-related killer.” And even that is a statement about which laymen are entitled to skepticism. Does that statement sound right? After all, most people prefer summer to winter. Dressing for the weather is less involved in the summer, and in winter just getting out of bed takes more will power.
Of course, many things that start out counter-intuitive turn out to be true. So the impression we get from daily experience doesn’t necessarily prove that Thrive Indianapolis is wrong. And scientists tell us every day how bad global warming is.
But other scientists tell us just the opposite. And, as the great Twentieth-Century physicist Richard Feynman said, science is the belief in the ignorance of experts. So press-selected scientists’ pronouncements shouldn’t make us ignore what we know. In this case what we know should make us demand compelling evidence before we accept that, say, the Centers for Disease Control and Prevention were mistaken in instead reporting that cold is the greater killer.
We should also ask questions when temperature records seem to suggest that we’re on the verge of a climate calamity. For example, here’s a portion of the National Oceanic and Atmospheric Administration (“NOAA”) data for central Indiana:
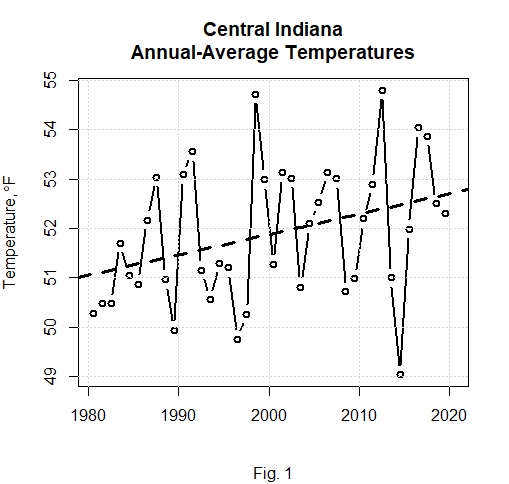
It clearly exhibits a warming trend. Filtering can make the trend appear even more dramatic:
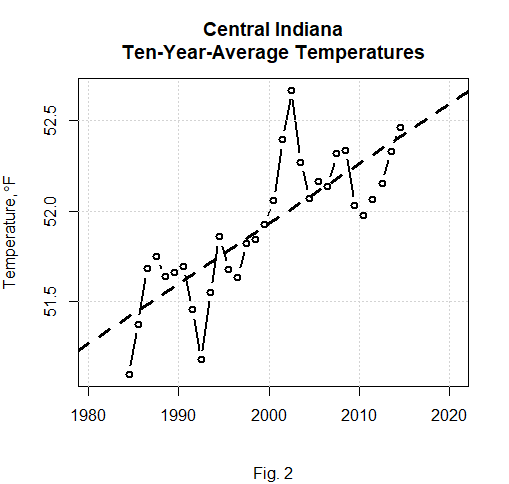
Whichever way it’s presented, the intended message is the same. While we’ve been emitting carbon dioxide over the last forty years the temperature in central Indiana has increased by 1.3°F. At this rate it will increase another 2.6°F by the end of the century.
That this is a bad thing seems to be taken on faith. So does the conclusion that we should stop emitting carbon dioxide—even though doing so will make a difference of less than two thousandths of a Fahrenheit degree. Rather than blindly accept such conclusions, maybe we should ask ourselves some questions first.
For example, how detrimental to Indianapolis residents has that 1.3°F increase been? Do people in central Indiana really suffer more from weather now than they did forty years ago? It’s far from self-evident that they do. Maybe, in fact, the change has been an improvement. Maybe another 2.6°F would be better still.
Even if in some ways it wouldn’t be, there’s no reason to believe that adapting to the change would be challenging. After all, Fig. 1 shows that the change from one year to the next has been as much as 4.5°F in a single year, and we’ve gotten along just fine, thank you. Furthermore, what reason is there to take that last forty years’ rate of increase and project it over the next 80 years?
True, scientists make projections all the time. But when they do they tend to be wrong. In The Population Bomb, for example, Paul Ehrlich projected worldwide famine by the 1980s, while John Holdren could become director of the Obama administration’s Office of Science and Technology Policy by saying things like “carbon-dioxide climate-induced famines could kill as many as a billion people before the year 2020.” Climate and environmental catastrophes have been predicted for over half a century, and with remarkable consistency they turn out to be wrong.
This brings to mind a famous quote from Mark Twain’s Life on the Mississippi:
“In the space of one hundred and seventy six years the Lower Mississippi has shortened itself two hundred and forty-two miles. That is an average of a trifle over a mile and a third per year. Therefore, any calm person, who is not blind or idiotic, can see that in the Old Oölitic Silurian Period, just a million years ago next November, the Lower Mississippi was upwards of one million three hundred thousand miles long, and stuck out over the Gulf of Mexico like a fishing-pole. And by the same token any person can see that seven hundred and forty-two years from now the Lower Mississippi will be only a mile and three-quarters long, and Cairo and New Orleans will have joined their streets together and be plodding comfortably along under a single mayor and a mutual board of aldermen. There is something fascinating about science. One gets such wholesale returns of conjecture out of such a trifling investment of fact.”
Projecting is a notoriously parlous exercise, so we laymen would be well-advised to take stock of what we know instead of blindly accepting what scientists say when they engage in it.
One way to do that is to consider a time horizon longer than we often see.

Fig. 3 shows that the entire NOAA record exhibits an overall trend of only 0.7°F per century: much lower than the 4.1°F-per-century value we get by considering only the last forty years. It also shows that a forty-year trend of 3.7°F per century had similarly occurred early in the last century, before man’s carbon-dioxide emissions were much of a factor. If people at that time had projected today’s temperatures in the way in which today we’re often invited to project end-of-this-century temperatures, the result would have been about 2.2°F higher than what current temperatures actually are.
And what if temperatures really had increased that much? In something as complex as the climate one can always find drawbacks when changes occur (as they always have). But a greater temperature increase would have reduced our heating bills and lengthened our growing season. Do we really know that the benefits wouldn’t have outweighed the drawbacks? Is the climate really that much worse in, say, Cincinnati than in Indianapolis?
That it is isn’t particularly clear. And a more-detailed view of the overall record gives us more reason to doubt the prophets of doom.
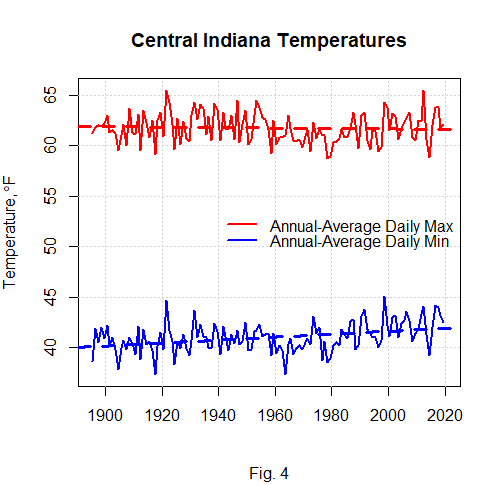
What Fig. 4 shows is that the modest trend exhibited by the total record is caused mainly by moderation in the daily low temperatures; the daily highs have actually fallen slightly, by 0.18°F per century, averaging a comfortable 62°F. We also see that the overall trend is dwarfed by the temperature range we experience on a daily basis.
Plotting those annual averages against a monthly-average background provides still further perspective:
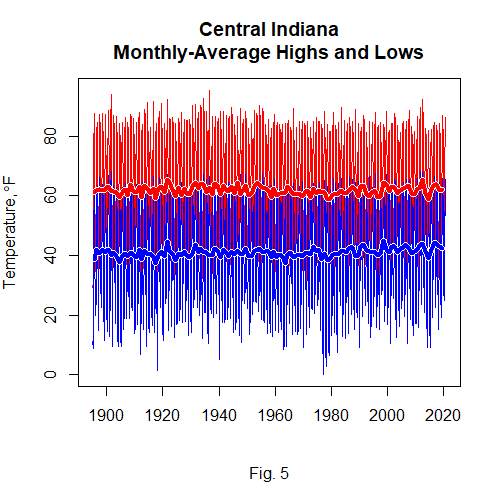
Fig. 5 shows that those trends are virtually imperceptible in comparison with the temperature variations we experience routinely. And don’t forget that during most of the year we have to heat our homes and wear coats or jackets, so on balance warming is usually welcome.
Still, some summer days can be oppressive, and warming may not be as welcome in July and August. So let’s look at what global warming has done to local summer highs:
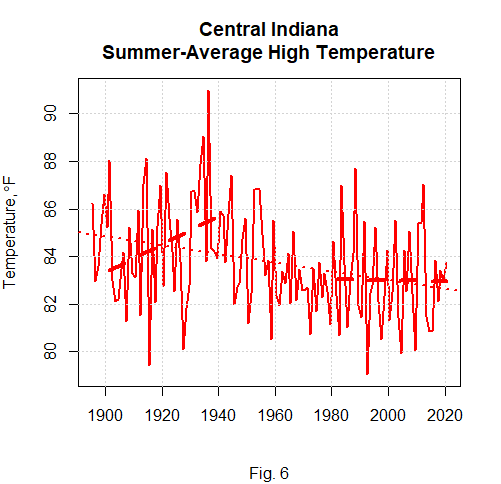
Fig. 6 shows that early in the last century, before we emitted much carbon dioxide, the forty-year trend in summer daily highs reached 7.7°F per century. But the forty-year trend has been negligible now that we emit over fourteen million metric tons of carbon dioxide a year.
This isn’t the impression conveyed by the Thrive Indianapolis’s statements “based on historic trends from 1951–2014” that Indianapolis’s annual-average-temperature increase in 2018 was 2.2°F and that its summer temperatures will rise 3–9°F by the year 2050.
Like the boxcar emissions number, those numbers don’t mean what taking them out of context makes them seem to. When we investigate for ourselves we find that what little warming Indianapolis has experienced actually made the Indianapolis climate milder. Just as we found that the temperature effect of Indianapolis’s seemingly alarming emissions would be undetectable even by a fever thermometer.
Unfortunately, missing context afflicts too many of the numbers that politicians use to justify government expenditures. So we need to stay skeptical.